Workshop Welcome and Introduction
Overview
Teaching: 15 min
Exercises: 0 minQuestions
What should I expect in participating in this workshop?
Objectives
Introduce instructors and mentors.
Provide overview of the three schedule.
Spotlight helpful network provided by Slack channel.
DUNE Computing Consortium
The goal of the DUNE Computing Consortium is to establish a global computing network that can handle the massive data dumps DUNE will produce by distributing them across the grid. It coordinates all DUNE computing activities and provides to new members the documentation and training to acquaint them with the specific and DUNE software and resources.
Coordinator: Heidi Schellman (Oregon State University)
Welcome Session Video
Tutorial Instructors
Organizers:
- Claire David (York University / FNAL)
- David DeMuth (Valley City State University)
Lecturers (in order of appearance in the schedule):
- Michael Kirby (FNAL): storage spaces
- Steven Timm (FNAL): data management
- Tom Junk (FNAL): LArSoft
- Kenneth Herner (FNAL): grid and batch job submission
Mentors
- Amit Bashyal (ANL)
- Carlos Sarasty (University of Cincinnati)
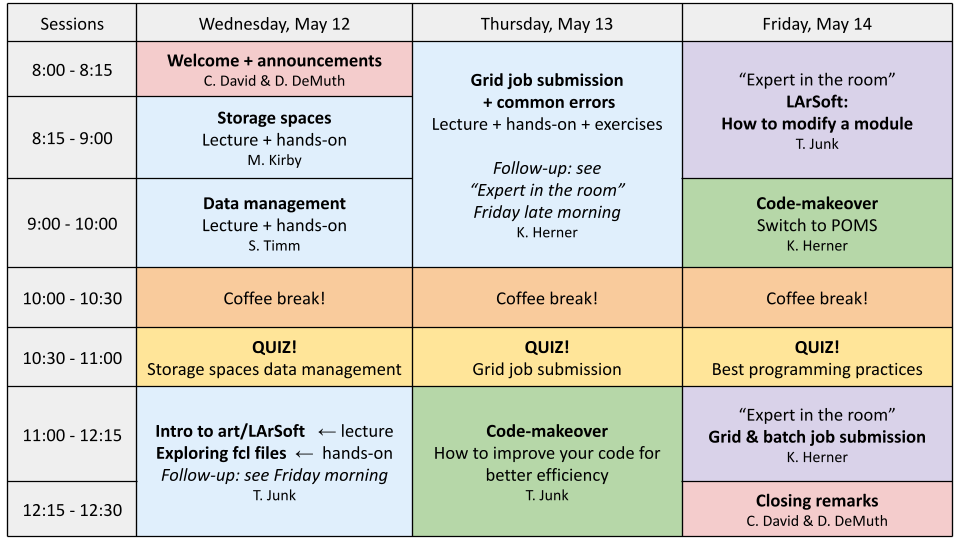
Schedule
The workshop spans three days.
Support
There will be live documents linked from Indico for each Zoom session. You can write questions there, anonymously or not, and experts will reply. The chat on Zoom can quickly saturate so this is a more convenient solution and proved very successful at the previous training. We will collect all questions and release a Q&A after the event.
You can join DUNE’s Slack: dunescience.slack.com. We created a special channel computing_training_may2021 for technical support, join here.
Key Points
This workshop is brought to you by the DUNE Computing Consortium.
The goals are to give you the computing basis to work on DUNE.
Storage Spaces
Overview
Teaching: 45 min
Exercises: 0 minQuestions
What are the types and roles of DUNE’s data volumes?
What are the commands and tools to handle data?
Objectives
Understanding the data volumes and their properties
Displaying volume information (total size, available size, mount point, device location)
Differentiating the commands to handle data between grid accessible and interactive volumes
Session Video
Introduction
There are three types of storage volumes that you will encounter at Fermilab: local hard drives, network attached storage, and large-scale, distributed storage. Each has it’s own advantages and limitations, and knowing which one to use when isn’t all straightforward or obvious. But with some amount of foresight, you can avoid some of the common pitfalls that have caught out other users.
Vocabulary
What is immutable? A file is immutable means that once it is written to the volume it cannot be modified, only read, moved, or deleted. Not a good choice for code or other files you want to change.
What is interactive or POSIX? Interactive volumens, or volume with POSIX access (Portable Operating System Interface Wikipedia) allow users to directly read, write and modify using standard commands, e.g. using bash language.
What is meant by ‘grid accessible’? Volumes that are grid accessible require specific tool suites to handle data stored there. This will be explained in the following sections.
Interactive storage volumes
Home area is similar to the user’s local hard drive but network mounted
- access speed to the volume very high, on top of full POSIX access
- they NOT safe to store certificates and tickets
- not accessible as an output location from grid worker nodes
- not for code developement (size of less than 2 GB)
- You need a valid Kerberos ticket in order to access files in your Home area
- Periodic snapshots are taken so you can recover deleted files. /nashome/.snapshot
Locally mounted volumes are local physical disks, mounted directly
- mounted on the machine with direct links to the /dev/ location
- used as temporary storage for infrastructure services (e.g. /var, /tmp,)
- can be used to store certificates and tickets. These are saved there automatically with owner-read permission and other permissions disabled.
- usually very small and should not be used to store data files or for code development
- Data on these volumes is not backed up.
Network Attached Storage (NAS) element behaves similar to a locally mounted volume.
- functions similar to services such as Dropbox or OneDrive
- fast and stable access rate
- volumes available only on a limited number of computers or servers
- not available to on larger grid computing
- /dune/app has periodic snapshots in /dune/app/.snapshot, but /dune/data and /dune/data2 do not.
Grid-accessible storage volumes
At Fermilab, an instance of dCache+Enstore is used for large-scale, distributed storage with capacity for more than 100 PB of storage and O(10000) connections. Whenever possible, these storage elements should be accessed over xrootd (see next section) as the mount points on interactive nodes are slow and unstable. Here are the different dCache volumes:
Persistent dCache: the data in the file is actively available for reads at any time and will not be removed until manually deleted by user
Scratch dCache: large volume shared across all experiments. When a new file is written to scratch space, old files are removed in order to make room for the newer file.
Resilient dCache: handles custom user code for their grid jobs, often in the form of a tarball. Inappropriate to store any other files here.
Tape-backed dCache: disk based storage areas that have their contents mirrored to permanent storage on Enstore tape.
Files are not available for immediate read on disk, but needs to be ‘staged’ from tape first.
Summary on storage spaces
Full documentation: Understanding Storage Volumes
In the following table, <exp> stands for the experiment (uboone, nova, dune, etc…)
| Quota/Space | Retention Policy | Tape Backed? | Retention Lifetime on disk | Use for | Path | Grid Accessible | |
|---|---|---|---|---|---|---|---|
| Persistent dCache | No/~100 TB/exp | Managed by Experiment | No | Until manually deleted | immutable files w/ long lifetime | /pnfs/<exp>/persistent | Yes |
| Scratch dCache | No/no limit | LRU eviction - least recently used file deleted | No | Varies, ~30 days (NOT guaranteed) | immutable files w/ short lifetime | /pnfs/<exp>/scratch | Yes |
| Resilient dCache | No/no limit | Periodic eviction if file not accessed | No | Approx 30 days (your experiment may have an active clean up policy) | input tarballs with custom code for grid jobs (do NOT use for grid job outputs) | /pnfs/<exp>/resilient | Yes |
| Tape backed | dCache No/O(10) PB | LRU eviction (from disk) | Yes | Approx 30 days | Long-term archive | /pnfs/dune/… | Yes |
| NAS Data | Yes (~1 TB)/ 32+30 TB total | Managed by Experiment | No | Till manually deleted | Storing final analysis samples | /dune/data | No |
| NAS App | Yes (~100 GB)/ ~15 TB total | Managed by Experiment | No | Until manually deleted | Storing and compiling software | /dune/app | No |
| Home Area (NFS mount) | Yes (~10 GB) | Centrally Managed by CCD | No | Until manually deleted | Storing global environment scripts (All FNAL Exp) | /nashome/<letter>/<uid> | No |
Commands and tools
This section will teach you the main tools and commands to display storage information and access data.
The df command
To find out what types of volumes are available on a node can be achieved with the command df. The -h is for human readable format. It will list a lot of information about each volume (total size, available size, mount point, device location).
df -h
Exercise 1
From the output of the
df -hcommand, identify:
- the home area
- the NAS storage spaces
- the different dCache volumes
ifdh
Another useful data handling command you will soon come across is ifdh. This stands for Intensity Frontier Data Handling. It is a tool suite that facilitates selecting the appropriate data transfer method from many possibilities while protecting shared resources from overload. You may see ifdhc, where c refers to client.
Here is an example to copy a file. Refer to the Mission Setup for the setting up the DUNETPC_VERSION.
source /cvmfs/dune.opensciencegrid.org/products/dune/setup_dune.sh
setup dunetpc $DUNETPC_VERSION -q e19:prof
setup_fnal_security
ifdh cp root://fndca1.fnal.gov:1094/pnfs/fnal.gov/usr/dune/tape_backed/dunepro/physics/full-reconstructed/2019/mc/out1/PDSPProd2/22/60/37/10/PDSPProd2_protoDUNE_sp_reco_35ms_sce_off_23473772_0_452d9f89-a2a1-4680-ab72-853a3261da5d.root /dev/null
Resource: idfh commands
Exercise 2
Using the ifdh command, complete the following tasks:
- create a directory in your dCache scratch area (/pnfs/dune/scratch/users/${USER}/) called “DUNE_tutorial_May2021”
- copy your ~/.bashrc file to that directory.
- copy the .bashrc file from your scrtach directory DUNE_tutorial_May2021 dCache to /dev/null
- remove the directory DUNE_tutorial_May2021 using “ifdh rmdir /pnfs/dune/scratch/users/${USER}/DUNE_tutorial_May2021” Note, if the destination for an ifdh cp command is a directory instead of filename with full path, you have to add the “-D” option to the command line. Also, for a directory to be deleted, it must be empty.
xrootd
The eXtended ROOT daemon is software framework designed for accessing data from various architectures and in a complete scalable way (in size and performance).
XRootD is most suitable for read-only data access. XRootD Man pages
Issue the following commands and try to understand how the first command enables completing the parameters for the second command.
pnfs2xrootd /pnfs/dune/scratch/users/${USER}/
xrdfs root://fndca1.fnal.gov:1094/ ls /pnfs/fnal.gov/usr/dune/scratch/users/${USER}/DUNE_tutorial_May2021
Let’s practice
Exercise 3
Using a combination of
ifdhandxrootdcommands discussed previously:
- Use
ifdhlocateFile to find the directory for this filePDSPProd4a_protoDUNE_sp_reco_stage1_p1GeV_35ms_sce_off_43352322_0_20210427T162252Z.root- Use
pnfs2xrootdto get thexrootdURI for that file.- Use
xrdcpto copy that file to/dev/null- Using
xrdfsand thelsoption, count the number of files in the same directory asPDSPProd4a_protoDUNE_sp_reco_stage1_p1GeV_35ms_sce_off_43352322_0_20210427T162252Z.root
Note that redirecting the standard output of a command into the command wc -l will count the number of lines in the output text. e.g. ls -alrth ~/ | wc -l
Useful links to bookmark
- ifdh commands (redmine)
- Understanding storage volumes (redmine)
- How DUNE storage works: pdf
Key Points
Home directories are centrally managed by Computing Division and meant to store setup scripts or certificates.
Network attached storage (NAS) /dune/app is primarily for code development.
The NAS /dune/data is for store ntuples and small datasets.
dCache volumes (tape, resilient, scratch, persistent) offer large storage with various retention lifetime.
The tool suites idfh and XRootD allow for accessing data with appropriate transfer method and in a scalable way.
Data Management
Overview
Teaching: 45 min
Exercises: 0 minQuestions
What are the data management tools and software for DUNE?
How are different software versions handled?
What are the best data management practices?
Objectives
Learn how to access data from DUNE Data Catalog
Understand the roles of the tools UPS, mrb and CVMFS
Session Video
Introduction
DUNE data is stored around the world and the storage elements are not always organized in a way that they can be easily inspected. For this purpose we use the SAM web client.
What is SAM?
Sequential Access with Metadata (SAM) is a data handling system developed at Fermilab. It is designed to tracklocations of files and other file metadata.
This lecture will show you how to access data files that have been defined to the DUNE Data Catalog. Execute the following commands after logging in to the DUNE interactive node, and sourcing the main dune setups.
Once per session:
setup sam_web_client
export SAM_EXPERIMENT=dune
What is Rucio?
Rucio is the next-generation Data Replica service and is part of DUNE’s new Distributed Data Management (DDM) system that is currently in deployment. Rucio has two functions:
- A rule-based system to get files to Rucio Storage Elements around the world and keep them there.
- To return the “nearest” replica of any data file for use either in interactive or batch file use. It is expected that most DUNE users will not be regularly using direct Rucio commands, but other wrapper scripts that calls them indirectly.
As of the date of this May 2021 tutorial:
- The Rucio client is not installed as a part of the standard DUNE client software
- Most DUNE users are not yet enabled to use it. But when we do, some of the commands will look like this:
rucio list-file-replicas protodune-sp:np04_raw_run005801_0001_dl1.root

rucio download protodune-sp:np04_raw_run005801_0001_dl1.root

rucio list-rses
Finding data
If you know a given file and want to locate it, e.g.:
samweb locate-file np04_raw_run005758_0001_dl3.root
This will give you output that looks like:
rucio:protodune-sp
cern-eos:/eos/experiment/neutplatform/protodune/rawdata/np04/detector/None/raw/07/42/28/49
castor:/neutplatform/protodune/rawdata/np04/detector/None/raw/07/42/28/49
enstore:/pnfs/dune/tape_backed/dunepro/protodune/np04/beam/detector/None/raw/07/42/28/49(597@vr0337m8)
which is the locations of the file on disk and tape. We can use this to copy the file from tape to our local disk.
To list raw data files for a given run:
samweb list-files "run_number 5758 and run_type protodune-sp and data_tier raw"
np04_raw_run005758_0001_dl3.root
np04_raw_run005758_0002_dl2.root
...
np04_raw_run005758_0065_dl10.root
np04_raw_run005758_0065_dl4.root
What about a reconstructed version?
samweb list-files "run_number 5758 and run_type protodune-sp and data_tier full-reconstructed and version (v07_08_00_03,v07_08_00_04)"
np04_raw_run005758_0053_dl7_reco_12891068_0_20181101T222620.root
np04_raw_run005758_0025_dl11_reco_12769309_0_20181101T213029.root
np04_raw_run005758_0053_dl2_reco_12891066_0_20181101T222620.root
...
np04_raw_run005758_0061_dl8_reco_14670148_0_20190105T175536.root
np04_raw_run005758_0044_dl6_reco_14669100_0_20190105T172046.root
The above is truncated output to show us the one reconstructed file that is the child of the raw data file above.
To see the total number of files that match a certain query expression, then add the --summary option to samweb list-files.
samweb allows you to select on a lot of parameters which are documented here:
-
dune-data.fnal.gov lists some official dataset definitions
Accessing data for use in your analysis
To access data without copying it, XRootD is the tool to use. However it will work only if the file is staged to the disk.
You can stream files worldwide if you have a DUNE VO certificate as described in the preparation part of this tutorial.
Where is the file?
An example to find a given file:
samweb get-file-access-url np04_raw_run005758_0001_dl3_reco_13600804_0_20181127T081955.root --schema=root
root://fndca1.fnal.gov:1094/pnfs/fnal.gov/usr/dune/tape_backed/dunepro/protodune/np04/beam/output/detector/full-reconstructed/08/61/68/00/np04_raw_run005758_0001_dl3_reco_13600804_0_20181127T081955.root
Resource: Using the SAM Data Catalog.
Exercise 1
- Use the
--locationargument to show the path of the file above on eitherenstore,castororcern-eos.- Use
get-metadatato get SAM metadata for this file. Note that--jsongives the output in json format.
When we are analyzing large numbers of files in a group of batch jobs, we use a SAM snapshot to describe the full set of files that we are going to analyze and create a SAM Project based on that. Each job will then come up and ask SAM to give it the next file in the list. SAM has some capability to grab the nearest copy of the file. For instance if you are running at CERN and analyzing this file it will automatically take it from the CERN storage space EOS.
Exercise 2
- use the samweb describe-definition command to see the dimensions of data set PDSPProd4_MC_1GeV_reco1_sce_datadriven_v1
- use the samweb list-definition-files command with the –summary option to see the total size of PDSPProd4_MC_1GeV_reco1_sce_datadriven_v1
- use the samweb take-snapshot command to make a snapshot of PDSPProd4_MC_1GeV_reco1_sce_datadriven_v1
What is UPS and why do we need it?
An important requirement for making valid physics results is computational reproducibility. You need to be able to repeat the same calculations on the data and MC and get the same answers every time. You may be asked to produce a slightly different version of a plot for example, and the data that goes into it has to be the same every time you run the program.
This requirement is in tension with a rapidly-developing software environment, where many collaborators are constantly improving software and adding new features. We therefore require strict version control; the workflows must be stable and not constantly changing due to updates.
DUNE must provide installed binaries and associated files for every version of the software that anyone could be using. Users must then specify which version they want to run before they run it. All software dependencies must be set up with consistent versions in order for the whole stack to run and run reproducibly.
The Unix Product Setup (UPS) is a tool to handle the software product setup operation.
UPS is set up when you setup DUNE:
source /cvmfs/dune.opensciencegrid.org/products/dune/setup_dune.sh
This sourcing defines the UPS setup command. Now to get DUNE’s LArSoft-based software, this is done through:
setup dunetpc $DUNETPC_VERSION -q e19:prof
dunetpc: product name
$DUNETPC_VERSION version tag
e19:prof are “qualifiers”. Qualifiers are separated with colons and may be specified in any order. The “e19” qualifier refers to a specific version of the gcc compiler suite, and “prof” means select the installed product that has been compiled with optimizations turned on. An alternative to “prof” is the “debug” qualifier. All builds of LArSoft and dunetpc are compiled with debug symbols turned on, but the “debug” builds are made with optimizations turned off. Both kinds of software can be debugged, but it is easier to debug the debug builds (code executes in the proper order and variables aren’t optimized away so they can be inspected).
Another specifier of a product install is the “flavor”. This refers to the operating system the program was compiled for. These days we only support SL7, but in the past we used to also support SL6 and various versions of macOS. The flavor is automatically selected when you set up a product using setup (unless you override it which is usually a bad idea). Some product are “unflavored” because they do not contain anything that depends on the operating system. Examples are products that only contain data files or text files.
Setting up a UPS product defines many environment variables. Most products have an environment variable of the form <productname>_DIR, where <productname> is the name of the UPS product in all capital letters. This is the top-level directory and can be used when searching for installed source code or fcl files for example. <productname>_FQ_DIR is the one that specifies a particular qualifier and flavor.
Exercise 3
- show all the versions of dunetpc that are currently available by using the “ups list -aK+ dunetpc” command
- pick one version and substitute that for DUNETPC_VERSION above and set up dunetpc
Many products modify the following search path variables, prepending their pieces when set up. These search paths are needed by art jobs.
PATH: colon-separated list of directories the shell uses when searching for programs to execute when you type their names at the command line. The command “which” tells you which version of a program is found first in the PATH search list. Example:
which lar
will tell you where the lar command you would execute is if you were to type “lar” at the command prompt.
The other paths are needed by art for finding plug-in libraries, fcl files, and other components, like gdml files.
CET_PLUGIN_PATH
LD_LIBRARY_PATH
FHICL_FILE_PATH
FW_SEARCH_PATH
Also the PYTHONPATH describes where Python modules will be loaded from.
UPS basic commands
| Command | Action |
|---|---|
ups list -aK+ dunetpc |
List the versions and flavors of dunetpc that exist on this node |
ups active |
Displays what has been setup |
ups depend dunetpc v08_57_00 -q e19:prof:py2 |
Displays the dependencies for this version of dunetpc |
Exercise 4
- show all the dependencies of dunetpc by using “ups depend dunetpc $DUNETPC_VERSION -q e19:prof”
UPS Docmentation Links
mrb
What is mrb and why do we need it?
Early on, the LArSoft team chose git and cmake as the software version manager and the build language, respectively, to keep up with industry standards and to take advantage of their new features. When we clone a git repository to a local copy and check out the code, we end up building it all. We would like LArSoft and DUNE code to be more modular, or at least the builds should reflect some of the inherent modularity of the code.
Ideally, we would like to only have to recompile a fraction of the software stack when we make a change. The granularity of the build in LArSoft and other art-based projects is the repository. So LArSoft and DUNE have divided code up into multiple repositories (DUNE ought to divide more than it has, but there are a few repositories already with different purposes). Sometimes one needs to modify code in multiple repositories at the same time for a particular project. This is where mrb comes in.
mrb stands for “multi-repository build”. mrb has features for cloning git repositories, setting up build and local products environments, building code, and checking for consistency (i.e. there are not two modules with the same name or two fcl files with the same name). mrb builds UPS products – when it installs the built code into the localProducts directory, it also makes the necessasry UPS table files and .version directories. mrb also has a tool for making a tarball of a build product for distribution to the grid. The software build example later in this tutorial exercises some of the features of mrb.
| Command | Action |
|---|---|
mrb --help |
prints list of all commands with brief descriptions |
mrb \<command\> --help |
displays help for that command |
mrb gitCheckout |
clone a repository into working area |
mrbsetenv |
set up build environment |
mrb build -jN |
builds local code with N cores |
mrb b -jN |
same as above |
mrb install -jN |
installs local code with N cores |
mrb i -jN |
same as above (this will do a build also) |
mrbslp |
set up all products in localProducts… |
mrb z |
get rid of everything in build area |
Link to the mrb reference guide
Exercise 5
There is no exercise 5. mrb example exercises will be covered in Friday morning’s session as any useful exercise with mrb takes more than 30 minutes on its own. Everyone gets 100% credit for this exercise!
CVMFS
What is CVMFS and why do we need it?
DUNE has a need to distribute precompiled code to many different computers that collaborators may use. Installed products are needed for four things:
- Running programs interactively
- Running programs on grid nodes
- Linking programs to installed libraries
- Inspection of source code and data files
Results must be reproducible, so identical code and associated files must be distributed everywhere. DUNE does not own any batch resources – we use CPU time on computers that participating institutions donate to the Open Science Grid. We are not allowed to install our software on these computers and must return them to their original state when our programs finish running so they are ready for the next job from another collaboration.
CVMFS is a perfect tool for distributing software and related files. It stands for CernVM File System (VM is Virtual Machine). Local caches are provided on each target computer, and files are accessed via the /cvmfs mount point. DUNE software is in the directory /cvmfs/dune.opensciencegrid.org, and LArSoft code is in /cvmfs/larsoft.opensciencegrid.org. These directories are auto-mounted and need to be visible when one executes ls /cvmfs for the first time. Some software is also in /cvmfs/fermilab.opensciencegrid.org.
CVMFS also provides a de-duplication feature. If a given file is the same in all 100 releases of dunetpc, it is only cached and transmitted once, not independently for every release. So it considerably decreases the size of code that has to be transferred.
When a file is accessed in /cvmfs, a daemon on the target computer wakes up and determines if the file is in the local cache, and delivers it if it is. If not, the daemon contacts the CVMFS repository server responsible for the directory, and fetches the file into local cache. In this sense, it works a lot like AFS. But it is a read-only filesystem on the target computers, and files must be published on special CVMFS publishing servers. Files may also be cached in a layer between the CVMFS host and the target node in a squid server, which helps facilities with many batch workers reduce the network load in fetching many copies of the same file, possibly over an international connection.
CVMFS also has a feature known as “Stashcache” or “xCache”. Files that are in /cvmfs/dune.osgstorage.org are not actually transmitted in their entirety, only pointers to them are, and then they are fetched from one of several regional cache servers or in the case of DUNE from Fermilab dCache directly. DUNE uses this to distribute photon library files, for instance.
CVMFS is by its nature read-all so code is readable by anyone in the world with a CVMFS client. CVMFS clients are available for download to desktops or laptops. Sensitive code can not be stored in CVMFS.
More information on CVMFS is available here
Exercise 6
- cd /cvmfs and do an ls at top level
- What do you see–do you see the four subdirectories (dune.opensciencegrid.org, larsoft.opensciencegrid.org, fermilab.opensciencegrid.org, and dune.osgstorage.org)
- cd dune.osgstorage.org/pnfs/fnal.gov/usr/dune/persistent/stash/PhotonPropagation/LibraryData
Useful links to bookmark
- Official dataset definitions: dune-data.fnal.gov
- UPS reference manual
- UPS documentation (redmine)
- UPS qualifiers: About Qualifiers (redmine)
- mrb reference guide (redmine)
- CVMFS on DUNE wiki: Access files in CVMFS
Key Points
SAM and Rucio are data handling systems used by the DUNE collaboration to retrieve data.
Staging is a necessary step to make sure files are on disk in dCache (as opposed to only on tape).
Xrootd allows user to stream data file.
The Unix Product Setup (UPS) is a tool to ensure consistency between different software versions and reproducibility.
The multi-repository build (mrb) tool allows code modification in multiple repositories, which is relevant for a large project like LArSoft with different cases (end user and developers) demanding consistency between the builds.
CVMFS distributes software and related files without installing them on the target computer (using a VM, Virtual Machine).
Coffee Break
Overview
Teaching: 30 min
Exercises: 0 minQuestions
How to take a good break?
Objectives
Relax
Clarify a vague point if it can’t wait until the next session.
Socialize with other participants to add perspective.
Coffee Time
We hope that you will utilize the coffee break time to relax. Of course if you want to wrap on the project at hand, use this extra time. Feel free to ask questions in the live documents.
We want to offer the possibility to exchange with the other participants. To this end, several breakout rooms will be opened during the breaks. Enjoy some social time and meet your new colleagues!
Both the main room and breakout rooms will be available during the coffee breaks.
Key Points
Coffee is good.
Networking with colleagues is essential.
Quiz on Storage Spaces and Data Management
Overview
Teaching: 30 min
Exercises: 0 minQuestions
Do you understand the storage spaces and data management principles?
Objectives
Validate your understanding by working through and discussing answers to several questions.
Quiz Time
Arrive on time at 10:30AM CST.
You will be assigned to breakout rooms, in teams of 6. You will have a couple of minutes to introduce yourself.
The questions will be available on Indico at 10:35AM CST. Refresh the timetable and you will see the slideshow.
Discuss solutions to each of the questions. Consider using Software Carpentry’s Etherpad for shared dialog.
You will have 20 minutes.
At the end of the session, a second slide show will be posted with answers.
Enjoy learning!
Session Video
Key Points
Practice makes perfect.
Introduction to art and LArSoft
Overview
Teaching: 90 min
Exercises: 0 minQuestions
Why do we need a complicated software framework? Can’t I just write standalone code?
Objectives
Learn what services the art framework provides.
Learn how the LArSoft tookit is organized and how to use it.
Session Video
Introduction to art
Art is the framework used for the offline software used to process LArTPC data from the far detector and the ProtoDUNEs. It was chosen not only because of the features it provides, but also because it allows DUNE to use and share algorithms developed for other LArTPC experiments, such as ArgoNeuT, MicroBooNE and ICARUS. The section below describes LArSoft, a shared software toolkit. Art is also used by the NOvA and mu2e experiments. The primary language for art and experiment-specific plug-ins is C++.
The art wiki page is here: https://cdcvs.fnal.gov/redmine/projects/art/wiki. It contains important information on command-line utilities, how to configure an art job, how to define, read in and write out data products, how and when to use art modules, services, and tools.
Art features:
- Defines the event loop
- Manages event data storage memory and prevents unintended overwrites
- Input file interface – allows ganging together input files
- Schedules module execution
- Defines a standard way to store data products in art-formatted ROOT files
- Defines a format for associations between data products (for example, tracks have hits, and associations between tracks and hits can be made via art’s association mechanism.
- Provides a uniform job configuration interface
- Stores job configuration information in art-formatted root files.
- Output file control – lets you define output filenames based on parts of the input filename.
- Message handling
- Random number control
- Exception handling
The configuration storage is particularly useful if you receive a data file from a colleague, or find one in a data repository and you want to know more about how it was produced, with what settings.
Getting set up to try the tools
Log in to a dunegpvm*.fnal.gov machine and set up your environment (This script is defined in Exercise 5 of https://dune.github.io/computing-training-202105/setup.html)
source ~/.dune_presetup_202105.sh
dune_setup
setup dunetpc $DUNETPC_VERSION -q e19:prof
setup_fnal_security
The examples below will refer to files in dCache at Fermilab which can best be accessed via xrootd.
For those with no access to Fermilab computing resources but with a CERN account:
Copies are stored in /afs/cern.ch/work/t/tjunk/public/may2021tutorialfiles/.
The follow-up of this tutorial provides help on how to find data and MC files in storage.
You can list available versions of dunetpc installed in CVMFS with this command:
ups list -aK+ dunetpc
The output is not sorted, although portions of it may look sorted. Do not depend on it being sorted. The string indicating the version is called the version tag (v09_22_02 here). The qualifiers are e19 and prof. Qualifiers can be entered in any order and are separated by colons. “e19” refers to a specific version of the gnu compiler collection (v8_2_0). We will soon be moving everything to “e20” which corresponds to gcc v9_3_0. We also compile with clang – the compiler qualifier for that is “c7”.
“prof” means “compiled with optimizations turned on.” “debug” means “compiled with optimizations turned off”. More information on qualifiers is here.
In addition to the version and qualifiers, UPS products have “flavors”. This refers to the operating system and version. Older versions of dunetpc and larsoft supported SL6 and some versions of macOS. Currently only SL7 and the compatible CentOS 7 are supported. The flavor of a product is automatically selected to match your current operating system when you set up a product. If a flavor is missing, you will get an error message.
There is a setup command provided by the operating system – you usually don’t want to use it (at least not when developing DUNE software). If you haven’t sourced the setup_dune.sh script in CVMFS above and type setup xyz, you will get the system setup command, which will ask you for the root password. Just control-C out of it, source the setup_dune.sh script, and try again.
UPS’s setup command (find out where it lives with this command):
type setup
will not only set up the product you specify (in the instructions above, dunetpc), but also all dependent products with corresponding versions so that you get a consistent software environment. You can get a list of everything that’s set up with this command
ups active
It is often useful to pipe the output through grep to find a particular product.
ups active | grep geant4
for example, to see what version of geant4 you have set up.
Art command-line tools
All of these command-line tools have online help. Invoke the help feature with the --help command-line option. Example:
config_dumper --help
Docmentation on art command-line tools is available on the art wiki page.
config_dumper
Configuration information for a file can be printed with config_dumper.
config_dumper -P <artrootfile>
Try it out:
config_dumper -P root://fndca1.fnal.gov:1094/pnfs/fnal.gov/usr/dune/tape_backed/dunepro/protodune-sp/full-reconstructed/2021/mc/out1/PDSPProd4/40/57/23/91/PDSPProd4_protoDUNE_sp_reco_stage1_p1GeV_35ms_sce_datadriven_41094796_0_20210121T214555Z.root
The output is an executable fcl file, sent to stdout. We recommend redirecting the output to a file that you can look at in a text editor:
Try it out:
config_dumper -P root://fndca1.fnal.gov:1094/pnfs/fnal.gov/usr/dune/tape_backed/dunepro/protodune-sp/full-reconstructed/2021/mc/out1/PDSPProd4/40/57/23/91/PDSPProd4_protoDUNE_sp_reco_stage1_p1GeV_35ms_sce_datadriven_41094796_0_20210121T214555Z.root > tmp.fcl
Your shell may be configured with noclobber, meaning that if you already have a file called tmp.fcl, the shell will refuse to overwrite it. Just rm tmp.fcl and try again.
The -P option to config_dumper is needed to tell config_dumper to print out all processing configuration fcl parameters. The default behavior of config_dumper prints out only a subset of the configuration parameters, and is most notably missing art services configuration.
Quiz
Quiz questions from the output of the above run of
config_dumper:
- What generators were used? What physics processes are simulated in this file?
- What geometry is used? (hint: look for “GDML” or “gdml”)
- What electron lifetime was assumed?
- What is the readout window size?
fhicl-dump
You can parse a FCL file with fhicl-dump.
Try it out:
fhicl-dump protoDUNE_refactored_g4_stage2.fcl
See the section below on FCL files for more information on what you’re looking at.
count_events
Try it out:
count_events root://fndca1.fnal.gov:1094/pnfs/fnal.gov/usr/dune/tape_backed/dunepro/protodune-sp/full-reconstructed/2021/mc/out1/PDSPProd4/40/57/23/91/PDSPProd4_protoDUNE_sp_reco_stage1_p1GeV_35ms_sce_datadriven_41094796_0_20210121T214555Z.root
product_sizes_dumper
You can get a peek at what’s inside an artroot file with product_sizes_dumper.
Try it out:
product_sizes_dumper -f 0 root://fndca1.fnal.gov:1094/pnfs/fnal.gov/usr/dune/tape_backed/dunepro/protodune-sp/full-reconstructed/2021/mc/out1/PDSPProd4/40/57/23/91/PDSPProd4_protoDUNE_sp_reco_stage1_p1GeV_35ms_sce_datadriven_41094796_0_20210121T214555Z.root
It is also useful to redirect the output of this command to a file so you can look at it with a text editor and search for items of interest. This command lists the sizes of the TBranches in the Events TTree in the artroot file. There is one TBranch per data product, and the name of the TBranch is the data product name, an “s” is appended (even if the plural of the data product name doesn’t make sense with just an “s” on the end), an underscore, then the module label that made the data product, an underscore, the instance name, an underscore, and the process name and a period.
Quiz questions, looking at the output from above.
Quiz
Questions:
- What is the name of the data product that takes up the most space in the file?
- What the module label for this data product?
- What is the module instance name for this data product? (tricky. You have to count underscores here).
- How many different modules produced simb::MCTruth data products? What are their module labels?
- How many different modules produced recob::Hit data products? What are their module labels?
You can open up an artoot file with ROOT and browse the TTrees in it with a TBrowser. Not all TBranches and leaves can be inspected easily this way, but enough can that it can save a lot of time programming if you just want to know something simple about a file such as whether it contains a particular data product and how many there are.
Try it out
root root://fndca1.fnal.gov:1094/pnfs/fnal.gov/usr/dune/tape_backed/dunepro/protodune-sp/full-reconstructed/2021/mc/out1/PDSPProd4/40/57/23/91/PDSPProd4_protoDUNE_sp_reco_stage1_p1GeV_35ms_sce_datadriven_41094796_0_20210121T214555Z.root
then at the root prompt, type:
new TBrowser
This will be faster with VNC. Navigate to the Events TTree in the file that is automatically opened, navigate to the TBranch with the Argon 39 MCTruths (it’s near the bottom), click on the branch icon simb::MCTruths_ar39__SinglesGen.obj, and click on the NParticles() leaf (It’s near the bottom. Yes, it has a red exclamation point on it, but go ahead and click on it). How many events are there? How many 39Ar decays are there per event on average?
Art is not constrained to using ROOT files – some effort has already been underway to use HDF5-formatted files for some purposes.
The art main executable program is a very short stub that interprets command-line options, reads in the configuration document (a FHiCL file which usually includes other FHiCL files), and loads shared libraries, initializes software components, and schedules execution of modules. Most code we are interested in is in the form of art plug-ins – modules, services, and tools. The generic executable for invoking art is called art, but a LArSoft-customized one is called lar. No additional customization has yet been applied so in fact, the lar executable has identical functionality to the art executable.
There is online help:
lar --help
All programs in the art suite have a --help command-line option.
Most art job invocations take the form
lar -n <nevents> -c fclfile.fcl artrootfile.root
where the input file specification is just on the command line without a command-line option. Explicit examples follow below. The -n <nevents> is optional – it specifies the number of events to process. If omitted, or if <nevents> is bigger than the number of events in the input file, the job processes all of the events in the input file. -n <nevents> is important for the generator stage. There’s also a handy --nskip <nevents_to_skip> argument if you’d like the job to start processing partway through the input file. You can steer the output with
lar -c fclfile.fcl artrootfile.root -o outputartrootfile.root -T outputhistofile.root
The outputhistofile.root file contains ROOT objects that have been declared with the TFileService service in user-supplied art plug-in code (i.e. your code).
Job configuration with FHiCL
The Fermilab Hierarchical Configuration Language, FHiCL is described here https://cdcvs.fnal.gov/redmine/documents/327.
It is not a Turing-complete language: you cannot write an executable program in it. It is meant to declare values for named parameters to steer job execution and adjust algorithm parameters (such as the electron lifetime in the simulation and reconstruction). Look at .fcl files in installed job directories, like $DUNETPC_DIR/job for examples. Fcl files are sought in the directory seach path FHICL_FILE_PATH when art starts up and when #include statements are processed. A fully-expanded fcl file with all the #include statements executed is referred to as a fhicl “document”.
Parameters may be defined more than once. The last instance of a parameter definition wins out over previous ones. This makes for a common idiom in changing one or two parameters in a fhicl document. The generic pattern for making a short fcl file that modifies a parameter is:
#include "fcl_file_that_does_almost_what_I_want.fcl"
block.subblock.parameter: new_value
To see what block and subblock a parameter is in, use fhcl-dump on the parent fcl file and look for the curly brackets. You can also use
lar -c fclfile.fcl --debug-config tmp.txt --annotate
which is equivalent to fhicl-dump with the –annotate option and piping the output to tmp.txt.
Entire blocks of parameters can be substituted in using @local and @table idioms. See the examples and documentation for guidance on how to use these. Generally they are defined in the PROLOG sections of fcl files. PROLOGs must precede all non-PROLOG definitions and if their symbols are not subsequently used they do not get put in the final job configuration document (that gets stored with the data and thus may bloat it). This is useful if there are many alternate configurations for some module and only one is chosen at a time.
Try it out:
fhicl-dump protoDUNE_refactored_g4_stage2.fcl > tmp.txt
Look for the parameter ModBoxA. It is one of the Modified Box Model ionization parameters. See what block it is in. Here are the contents of a modified g4 stage 2 fcl file that modifies just that parameter:
#include "protoDUNE_refactored_g4_stage2.fcl"
services.LArG4Parameters.ModBoxA: 7.7E-1
Exercise
Do a similar thing – modify the stage 2 g4 fcl configuration to change the drift field from 486.7 V/cm to 500 V/cm. Hint – you will find the drift field in an array of fields which also has the fields between wire planes listed.
Types of Plug-Ins
Plug-ins each have their own .so library which gets dynamically loaded by art when referenced by name in the fcl configuration.
Producer Modules
A producer module is a software component that writes data products to the event memory. It is characterized by produces<> and consumes<> statements in the class constructor, and art::Event::put() calls in the produces() method. A producer must produce the data product collection it says it produces, even if it is empty, or art will throw an exception. art::Event::put() transfers ownership of memory (use std::move so as not to copy the data) from the module to the art event memory. Data in the art event memory will be written to the output file unless output commands in the fcl file tell art not to do that. Documentation on output commands can be found in the LArSoft wiki here: https://cdcvs.fnal.gov/redmine/projects/larsoft/wiki/Rerun_part_of_all_a_job_on_an_output_file_of_that_job Producer modules have methods that are called on begin job, begin run, begin subrun, and on each event, as well as at the end of processing, so you can initialize counters or histograms, and finish up summaries at the end. Source code must be in files of the form:
Analyzer Modules
Analyzer modules read data product from the event memory and produce histograms or TTrees, or other output. They are typically scheduled after the producer modules have been run. Producer modules have methods that are called on begin job, begin run, begin subrun, and on each event, as well as at the end of processing, so you can initialize counters or histograms, and finish up summaries at the end. Source code must be in files of the form:
Source Modules
Source modules read data from input files and reformat it as need be, in order to put the data in art event data store. Most jobs use the art-provided RootInput source module which reads in art-formatted ROOT files. RootInput interacts well with the rest of the framework in that it provides lazy reading of TTree branches. Only when GetByLabel or GetValidHandle or other product get methods are called is the data actually fetched from the input file. This is useful for art jobs that only read a subset of the TBranches in an input file. Source code must be in files of the form:
Services
These are singleton classes that are globally visible within an art job. They can be FHiCL configured like modules, and they can schedule methods to be called on begin job, begin run, begin event, etc. They are meant to help supply configuration parameters like the drift velocity, or more complicated things like geometry functions, to modules that need them. Please do not use services as a back door for storing event data outside of the art event store. Source code must be in files of the form: <modulename>_service.cc, where servicename does not have any underscores in it.
Tools
Tools are FHiCL-configurable software components that are not singletons, like services. They are meant to be swappable by FHiCL parameters which tell art which .so libraries to load up, configure, and call from user code. See the Art Wiki Page for more information on tools and other plug-ins.
You can use cetskelgen to make empty skeletons of art plug-ins. See the art wiki for documentation, or use
cetskelgen --help
for instructions on how to invoke it.
Non-Plug-In Code
You are welcome to write standard C++ code – classes and C-style functions are no problem. In fact, to enhance the portability of code, the art team encourages the separation of algorithm code into non-framework-specific source files, and to call these functions or class methods from the art plug-ins. Typically, source files for standalone algorithm code have the extension .cxx while art plug-ins have .cc extensions. Most directories have a CMakeLists.txt file which has instructions for building the plug-ins, each of which is built into a .so library, and all other code gets built and put in a separate .so library.
Retrieving Data Products
In a producer or analyzer module, data products can be retrieved from the art event store with getByLabel() or getValidHandle() calls, or more rarely getManyByType or other calls. The arguments to these calls specify the module label and the instance of the data product. A typical TBranch name in the Events tree in an artroot file is
simb::MCParticles_largeant__G4Stage1.
here, simb::MCParticle is the name of the class that defines the data product. The “s” after the data product name is added by art – you have no choice in this even if the plural of your noun ought not to just add an “s”. The underscore separates the data product name from the module name, “largeant”. Another underscore separates the module name and the instance name, which in this example is the empty string – there are two underscores together there. The last string is the process name and usually is not needed to be specified in data product retrieval. You can find the TBranch names by browsing an artroot file with ROOT and using a TBrowser, or by using product_sizes_dumper -f 0.
Art documentation
There is a mailing list – art-users@fnal.gov where users can ask questions and get help.
There is a workbook for art available at https://art.fnal.gov/art-workbook/ Look for the “versions” link in the menu on the left for the actual document. It is a few years old and is missing some pieces like how to write a producer module, but it does answer some questions. I recommend keeping a copy of it on your computer and using it to search for answers.
There was an art/LArSoft course in 2015. While it, too is a few years old, the examples are quite good and it serves as a useful reference.
Gallery
Gallery is a lightweight tool that lets users read art-formatted root files and make plots without having to write and build art modules. It works well with interpreted and compiled ROOT macros, and is thus ideally suited for data exploration and fast turnaround of making plots. It lacks the ability to use art services, however, though some LArSoft services have been split into services and service providers. The service provider code is intended to be able to run outside of the art framework and linked into separate programs.
Gallery also lacks the ability to write data products to an output file. You are of course free to open and write files of your own devising in your gallery programs. There are example gallery ROOT scripts in dunetpc/dune/GalleryScripts. They are only in the git repository but do not get installed in the UPS product.
More documentation: https://art.fnal.gov/gallery/
LArSoft
Introductory Documentation
Using LArSoft: https://cdcvs.fnal.gov/redmine/projects/larsoft/wiki/Using_LArSoft.
Software structure
The LArSoft toolkit is a set of software components that simulate and reconstruct LArTPC data, and also it provides tools for accessing raw data from the experiments. LArSoft contains an interface to GEANT4 (art does not list GEANT4 as a dependency) and the GENIE generator. It contains geometry tools that are adapted for wire-based LArTPC detectors.
A recent graph of the UPS products in a full stack staring with protduneana is available here: https://wiki.dunescience.org/w/img_auth.php/8/87/Protoduneana_v09_22_02_e19_prof_graph.pdf You can see the LArSoft pieces under dunetpc, as well as GEANT4, GENIE, ROOT, and a few others.
LArSoft Data Products
A very good introduction to data products such as raw digits, calibrated waveforms, hits and tracks, that are created and used by LArSoft modules and usable by analyzers was given by Tingjun Yang at the 2019 ProtoDUNE analysis workshop: https://indico.fnal.gov/event/19133/contributions/50492/attachments/31462/38611/dataproducts.pdf.
There are a number of data product dumper fcl files. A non-exhaustive list of useful examples is given below:
 dump_mctruth.fcl
 dump_mcparticles.fcl
 dump_simenergydeposits.fcl
 dump_simchannels.fcl
 dump_simphotons.fcl
 dump_rawdigits.fcl
 dump_wires.fcl
 dump_hits.fcl
 dump_clusters.fcl
 dump_tracks.fcl
 dump_pfparticles.fcl
 eventdump.fcl
 dump_lartpcdetector_channelmap.fcl
 dump_lartpcdetector_geometry.fcl
Some of these may require some configuration of input module labels so they can find the data products of interest.
Some of these may require some configuration of input module labels so they can find the data products of interest. Try one of these yourself:
lar -n 1 -c dump_mctruth.fcl root://fndca1.fnal.gov:1094/pnfs/fnal.gov/usr/dune/tape_backed/dunepro/protodune-sp/full-reconstructed/2021/mc/out1/PDSPProd4/40/57/23/91/PDSPProd4_protoDUNE_sp_reco_stage1_p1GeV_35ms_sce_datadriven_41094796_0_20210121T214555Z.root
This command will make a file called DumpMCTruth.log which you can open in a text editor. Reminder: MCTruth are particles made by the generator(s), and MCParticles are those made by GEANT4, except for those owned by the MCTruth data products. Due to the showering nature of LArTPCs, there are usually many more MCParticles than MCTruths.
Examples and current workflows
The page with instructions on how to find and look at ProtoDUNE data has links to standard fcl configurations for simulating and reconstructing ProtoDUNE data: https://wiki.dunescience.org/wiki/Look_at_ProtoDUNE_SP_data.
Try it yourself! The workflow for ProtoDUNE-SP MC is given in the Simulation Task Force web page. https://wiki.dunescience.org/wiki/ProtoDUNE-SP_Simulation_Task_Force
Running on a dunegpvm machine at Fermilab
export USER=`whoami`
 mkdir -p /dune/data/users/$USER/tutorialtest
 cd /dune/data/users/$USER/tutorialtest
 source /cvmfs/dune.opensciencegrid.org/products/dune/setup_dune.sh
 setup dunetpc v09_22_02 -q e19:prof
 lar -n 1 -c mcc12_gen_protoDune_beam_cosmics_p1GeV.fcl -o gen.root
 lar -n 1 -c protoDUNE_refactored_g4_stage1.fcl gen.root -o g4_stage1.root
 lar -n 1 -c protoDUNE_refactored_g4_stage2_sce_datadriven.fcl g4_stage1.root -o g4_stage2.root
 lar -n 1 -c protoDUNE_refactored_detsim_stage1.fcl g4_stage2.root -o detsim_stage1.root
 lar -n 1 -c protoDUNE_refactored_detsim_stage2.fcl detsim_stage1.root -o detsim_stage2.root
 lar -n 1 -c protoDUNE_refactored_reco_35ms_sce_datadriven_stage1.fcl detsim_stage2.root -o reco_stage1.root
 lar -c eventdump.fcl reco_stage1.root >& eventdump_output.txt
 config_dumper -P reco_stage1.root >& config_output.txt
 product_sizes_dumper -f 0 reco_stage1.root >& productsizes.txt
Running at CERN
This example puts all files in a subdirectory of your home directory. There is an input file for the ProtoDUNE-SP beamline simulation that is copied over and you need to point the generation job at it. The above sequence of commands will work at CERN if you have a Fermilab grid proxy, but not everyone signed up for the tutorial can get one of these yet, so we copied the necessary file over and adjusted a fcl file to point at it. It also runs faster with the local copy of the input file than the above workflow which copies it.
 cd ~
 mkdir May2021Tutorial
 cd May2021Tutorial
 source /cvmfs/dune.opensciencegrid.org/products/dune/setup_dune.sh
 setup dunetpc v09_22_02 -q e19:prof
 cat > tmpgen.fcl << EOF
 #include "mcc12_gen_protoDune_beam_cosmics_p1GeV.fcl"
 physics.producers.generator.FileName: "/afs/cern.ch/work/t/tjunk/public/may2021tutorialfiles/H4_v34b_1GeV_-27.7_10M_1.root"
 EOF
 lar -n 1 -c tmpgen.fcl -o gen.root
 lar -n 1 -c protoDUNE_refactored_g4_stage1.fcl gen.root -o g4_stage1.root
 lar -n 1 -c protoDUNE_refactored_g4_stage2_sce_datadriven.fcl g4_stage1.root -o g4_stage2.root
 lar -n 1 -c protoDUNE_refactored_detsim_stage1.fcl g4_stage2.root -o detsim_stage1.root
 lar -n 1 -c protoDUNE_refactored_detsim_stage2.fcl detsim_stage1.root -o detsim_stage2.root
 lar -n 1 -c protoDUNE_refactored_reco_35ms_sce_datadriven_stage1.fcl detsim_stage2.root -o reco_stage1.root
 lar -c eventdump.fcl reco_stage1.root >& eventdump_output.txt
 config_dumper -P reco_stage1.root >& config_output.txt
 product_sizes_dumper -f 0 reco_stage1.root >& productsizes.txt
You can also browse the root files with a TBrowser or run other dumper fcl files on them. The dump example commands above redirect their outputs to text files which you can edit with a text editor or run grep on to look for things.
You can run the event display with
lar -c evd_protoDUNE.fcl reco_stage1.root
but it will run very slowly over a tunneled X connection. A VNC session will be much faster. Tips: select the “Reconstructed” radio button at the bottom and click on “Unzoom Interest” on the left to see the reconstructed objects in the three views.
DUNE software documentation and how-to’s
This wiki page provides a lot of information on how to check out, build, and contribute to dune-specific larsoft plug-in code.
https://cdcvs.fnal.gov/redmine/projects/dunetpc/wiki
The follow-up part of this tutorial gives hands-on exercises for doing these things.
Contributing to LArSoft
Unlike dunetpc, protoduneana and garsoft, which are hosted in Fermilab’s Redmine repository, the LArSoft git repositories are hosted on GitHub and use a pull-request model. LArSoft’s github link is https://github.com/larsoft
See the documentation at this link: https://cdcvs.fnal.gov/redmine/projects/larsoft/wiki/Developing_With_LArSoft
There are bi-weekly LArSoft coordination meetings https://indico.fnal.gov/category/405/ at which stakeholders, managers, and users discuss upcoming releases, plans, and new features to be added to LArSoft.
Useful tip: check out an inspection copy of larsoft
A good old-fashioned grep -r or a find command can be effective if you are looking for an example of how to call something but I do not know where such an example might live. The copies of LArSoft source in CVMFS lack the CMakeLists.txt files and if that’s what you’re looking for to find examples, it’s good to have a copy checked out. Here’s a script that checks out all the LArSoft source and DUNE LArSoft code but does not compile it. Warning: it deletes a directory called “inspect” in your app area. Make sure /dune/app/users/<yourusername> exists first:
 #!/bin/sh
 USERNAME=`whoami`
 LARSOFT_VERSION=v09_13_00
 COMPILER=e19
 source /cvmfs/dune.opensciencegrid.org/products/dune/setup_dune.sh
 cd /dune/app/users/${USERNAME}
 rm -rf inspect
 mkdir inspect
 cd inspect
 setup larsoft ${LARSOFT_VERSION} -q debug:${COMPILER}
 mrb newDev
 source /dune/app/users/${USERNAME}/inspect/localProducts_larsoft_${LARSOFT_VERSION}_debug_${COMPILER}/setup
 cd srcs
 mrb g larsoft_suite
 mrb g larsoftobj_suite
 mrb g larutils
 mrb g larbatch
 mrb g dunetpc
 mrb g duneutil
 mrb g -d dune_raw_data dune-raw-data
Putting it to use: A very common workflow in developing software is to look for an example of how to do something similar to what you want to do. Let’s say you want to find some examples of how to use FindManyP – it’s an art method for retrieving associations between data products, and the art documentation isn’t anywhere near as good as the examples for learning how to use it. You can use a recursive grep through your checked-out version, or you can even look through the installed source in CVMFS:
 cd $DUNETPC_DIR/source/dune
 grep -r -i findmanyp *
It is good to use the -i option to grep which tells it to ignore the difference between uppercase and lowercase string matches, in case you misremembered the case of what you are looking for. The list of matches is quite long – you may want to pipe the output of that grep into another grep
grep -r -i findmanyp * | grep recob::Hit
The checked-out versions of the software have the advantage of providing some files that don’t get installed in CVMFS, notably CMakeLists.txt files and the UPS product_deps files, which you may want to examine when looking for examples of how to do things.
GArSoft
GArSoft is another art-based software package, designed to simulate the ND-GAr near detector. Many components were copied from LArSoft and modified for the pixel-based TPC with an ECAL. You can find installed versions in CVMFS with the following command:
ups list -aK+ garsoft
and you can check out the source and build it by following the instructions on the GArSoft wiki: https://cdcvs.fnal.gov/redmine/projects/garsoft/wiki
Key Points
Art provides the tools physicists in a large collaboration need in order to contribute software to a large, shared effort without getting in each others’ way.
Art helps us keep track of our data and job configuration, reducing the chances of producing mystery data that no one knows where it came from.
LArSoft is a set of simulation and reconstruction tools shared among the liquid-argon TPC collaborations.
Grid Job Submission and Common Errors
Overview
Teaching: 120 min
Exercises: 0 minQuestions
How to submit grid jobs?
Objectives
Submit a job and understand what’s happening behind the scenes
Monitor the job and look at its outputs
Review best practices for submitting jobs (including what NOT to do)
Extension; submit a small job with POMS
Video Session Part 1 of 2
Submit a job
Note that job submission requires FNAL account but can be done from a CERN machine, or any other with CVMFS access.
First, log in to a dunegpvm machine (should work from lxplus too with a minor extra step of getting a Fermilab Kerberos ticket on lxplus via kinit). Then you will need to set up the job submission tools (jobsub). If you set up dunetpc it will be included, but if not, you need to do
source /cvmfs/dune.opensciencegrid.org/products/dune/setup_dune.sh
setup jobsub_client
Having done that, let us submit a prepared script:
jobsub_submit -G dune -M -N 1 --memory=1000MB --disk=1GB --cpu=1 --expected-lifetime=1h --resource-provides=usage_model=DEDICATED,OPPORTUNISTIC,OFFSITE -l '+SingularityImage=\"/cvmfs/singularity.opensciencegrid.org/fermilab/fnal-wn-sl7:latest\"' --append_condor_requirements='(TARGET.HAS_Singularity==true&&TARGET.HAS_CVMFS_dune_opensciencegrid_org==true&&TARGET.HAS_CVMFS_larsoft_opensciencegrid_org==true&&TARGET.CVMFS_dune_opensciencegrid_org_REVISION>=1105)' file:///dune/app/users/kherner/submission_test_singularity.sh
If all goes well you should see something like this:
/fife/local/scratch/uploads/dune/kherner/2021-01-20_120444.002077_4240
/fife/local/scratch/uploads/dune/kherner/2021-01-20_120444.002077_4240/submission_test_singularity.sh_20210120_120445_308543_0_1_.cmd
submitting....
Submitting job(s).
1 job(s) submitted to cluster 40351757.
JobsubJobId of first job: 40351757.0@jobsub01.fnal.gov
Use job id 40351757.0@jobsub01.fnal.gov to retrieve output
Quiz
- What is your job ID?
Now, let’s look at some of these options in more detail.
-Msends mail after the job completes whether it was successful for not. The default is email only on error. To disable all emails, use--mail_never.-Ncontrols the number of identical jobs submitted with each cluster. Also called the process ID, the number ranges from 0 to N-1 and forms the part of the job ID number after the period, e.g. 12345678.N.--memory, --disk, --cpu, --expected-lifetimerequest this much memory, disk, number of cpus, and max run time. Jobs that exceed the requested amounts will go into a held state. Defaults are 2000 MB, 10 GB, 1, and 8h, respectively. Note that jobs are charged against the DUNE FermiGrid quota according to the greater of memory/2000 MB and number of CPUs, with fractional values possible. For example, a 3000 MB request is charged 1.5 “slots”, and 4000 MB would be charged 2. You are charged for the amount requested, not what is actually used, so you should not request any more than you actually need (your jobs will also take longer to start the more resources you request). Note also that jobs that run offsite do NOT count against the FermiGrid quota. In general, aim for memory and run time requests that will cover 90-95% of your jobs and use the autorelease feature to deal with the remainder.--resource-provides=usage_modelThis controls where jobs are allowed to run. DEDICATED means use the DUNE FermiGrid quota, OPPORTUNISTIC means use idle FermiGrid resources beyond the DUNE quota if they are available, and OFFSITE means use non-Fermilab resources. You can combine them in a comma-separated list. In nearly all cases you should be setting this to DEDICATED,OPPORTUNISTIC,OFFSITE. This ensures maximum resource availability and will get your jobs started the fastest. Note that because of Singularity, there is absolutely no difference between the environment on Fermilab worker nodes and any other place. Depending on where your input data are (if any), you might see slight differences in network latency, but that’s it.-l(or--lines=) allows you to pass additional arbitrary HTCondor-styleclassadvariables into the job. In this case, we’re specifying exactly whatSingularityimage we want to use in the job. It will be automatically set up for us when the job starts. Any other valid HTCondorclassadis possible. In practice you don’t have to do much beyond theSingularityimage. Here, pay particular attention to the quotes and backslashes.--append_condor_requirementsallows you to pass additionalHTCondor-stylerequirements to your job. This helps ensure that your jobs don’t start on a worker node that might be missing something you need (a corrupt or out of dateCVMFSrepository, for example). Some checks run at startup for a variety ofCVMFSrepositories. Here, we check that Singularity invocation is working and that theCVMFSrepos we need ( dune.opensciencegrid.org and larsoft.opensciencegrid.org ) are in working order. Optionally you can also place version requirements on CVMFS repos (as we did here as an example), useful in case you want to use software that was published very recently and may not have rolled out everywhere yet.
Job Output
This particular test writes a file to /pnfs/dune/scratch/users/<username>/job_output_<id number>.log.
Verify that the file exists and is non-zero size after the job completes.
You can delete it after that; it just prints out some information about the environment.
More information about jobsub is available here and here.
Submit a job using the tarball containing custom code
First off, a very important point: for running analysis jobs, you may not actually need to pass an input tarball, especially if you are just using code from the base release and you don’t actually modify any of it. All you need to do is set up any required software from CVMFS (e.g. dunetpc and/or protoduneana), and you are ready to go. If you’re just modifying a fcl file, for example, but no code, it’s actually more efficient to copy just the fcl(s) your changing to the scratch directory within the job, and edit them as part of your job script (copies of a fcl file in the current working directory have priority over others by default).
Sometimes, though, we need to run some custom code that isn’t in a release. We need a way to efficiently get code into jobs without overwhelming our data transfer systems. We have to make a few minor changes to the scripts you made in the previous tutorial section, generate a tarball, and invoke the proper jobsub options to get that into your job. There are many ways of doing this but by far the best is to use the Rapid Code Distribution Service (RCDS), as shown in our example.
If you have finished up the LArSoft follow-up and want to use your own code for this next attempt, feel free to tar it up (you don’t need anything besides the localProducts* and work directories) and use your own tar ball in lieu of the one in this example. You will have to change the last line with your own submit file instead of the pre-made one.
First, we should make a tarball. Here is what we can do (assuming you are starting from /dune/app/users/username/):
cp /dune/app/users/kherner/setupMay2021Tutorial-grid.sh /dune/app/users/username/
cp /dune/app/users/kherner/may2021tutorial/localProducts_larsoft__e19_prof/setup-grid /dune/app/users/username/may2021tutorial/localProducts_larsoft__e19_prof/setup-grid
Before we continue, let’s examine these files a bit. We will source the first one in our job script, and it will set up the environment for us.
#!/bin/bash

DIRECTORY=may2021tutorial
# we cannot rely on "whoami" in a grid job. We have no idea what the local username will be.
# Use the GRID_USER environment variable instead (set automatically by jobsub).
USERNAME=${GRID_USER}

source /cvmfs/dune.opensciencegrid.org/products/dune/setup_dune.sh
export WORKDIR=${_CONDOR_JOB_IWD} # if we use the RCDS the our tarball will be placed in $INPUT_TAR_DIR_LOCAL.
if [ ! -d "$WORKDIR" ]; then
  export WORKDIR=`echo .`
fi

source ${INPUT_TAR_DIR_LOCAL}/${DIRECTORY}/localProducts*/setup-grid
mrbslp
Now let’s look at the difference between the setup-grid script and the plain setup script. Assuming you are currently in the /dune/app/users/username directory:
diff may2021tutorial/localProducts_larsoft__e19_prof/setup may2021tutorial/localProducts_larsoft__e19_prof/setup-grid
< setenv MRB_TOP "/dune/app/users/<username>/may2021tutorial"
< setenv MRB_TOP_BUILD "/dune/app/users/<username>/may2021tutorial"
< setenv MRB_SOURCE "/dune/app/users/<username>/may2021tutorial/srcs"
< setenv MRB_INSTALL "/dune/app/users/<username>/may2021tutorial/localProducts_larsoft__e19_prof"
---
> setenv MRB_TOP "${INPUT_TAR_DIR_LOCAL}/may2021tutorial"
> setenv MRB_TOP_BUILD "${INPUT_TAR_DIR_LOCAL}/may2021tutorial"
> setenv MRB_SOURCE "${INPUT_TAR_DIR_LOCAL}/may2021tutorial/srcs"
> setenv MRB_INSTALL "${INPUT_TAR_DIR_LOCAL}/may2021tutorial/localProducts_larsoft__e19_prof"
As you can see, we have switched from the hard-coded directories to directories defined by environment variables; the INPUT_TAR_DIR_LOCAL variable will be set for us (see below).
Now, let’s actually create our tar file. Again assuming you are in /dune/app/users/kherner/may2021tutorial/:
tar --exclude '.git' -czf may2021tutorial.tar.gz may2021tutorial/localProducts_larsoft__e19_prof may2021tutorial/work setupMay2021Tutorial-grid.sh
Then submit another job (in the following we keep the same submit file as above):
jobsub_submit -G dune -M -N 1 --memory=1800MB --disk=2GB --expected-lifetime=3h --cpu=1 --resource-provides=usage_model=DEDICATED,OPPORTUNISTIC,OFFSITE --tar_file_name=dropbox:///dune/app/users/<username>/may2021tutorial.tar.gz --use-cvmfs-dropbox -l '+SingularityImage=\"/cvmfs/singularity.opensciencegrid.org/fermilab/fnal-wn-sl7:latest\"' --append_condor_requirements='(TARGET.HAS_Singularity==true&&
TARGET.HAS_CVMFS_dune_opensciencegrid_org==true&&
TARGET.HAS_CVMFS_larsoft_opensciencegrid_org==true&&
TARGET.CVMFS_dune_opensciencegrid_org_REVISION>=1105&&
TARGET.HAS_CVMFS_fifeuser1_opensciencegrid_org==true&&
TARGET.HAS_CVMFS_fifeuser2_opensciencegrid_org==true&&
TARGET.HAS_CVMFS_fifeuser3_opensciencegrid_org==true&&
TARGET.HAS_CVMFS_fifeuser4_opensciencegrid_org==true)' file:///dune/app/users/kherner/run_May2021tutorial.sh
You’ll see this is very similar to the previous case, but there are some new options:
--tar_file_name=dropbox://automatically copies and untars the given tarball into a directory on the worker node, accessed via the INPUT_TAR_DIR_LOCAL environment variable in the job. As of now, only one such tarball can be specified. If you need to copy additional files into your job that are not in the main tarball you can use the -f option (see the jobsub manual for details). The value of INPUT_TAR_DIR_LOCAL is by default $CONDOR_DIR_INPUT/name_of_tar_file, so if you have a tar file named e.g. may2021tutorial.tar.gz, it would be $CONDOR_DIR_INPUT/may2021tutorial.--use-cvmfs-dropboxstages that tarball through the RCDS (really a collection of special CVMFS repositories). As of April 2021, it is now the default method for tarball transfer and the –use-cvmfs-dropbox option is not needed (though it will not hurt to keep if it your submission for now).- Notice that the
--append_condor_requirementsline is longer now, because we also check for the fifeuser[1-4]. opensciencegrid.org CVMFS repositories.
Now, there’s a very small gotcha when using the RCDS, and that is when your job runs, the files in the unzipped tarball are actually placed in your work area as symlinks from the CVMFS version of the file (which is what you want since the whole point is not to have N different copies of everything). The catch is that if your job script expected to be able to edit one or more of those files within the job, it won’t work because the link is to a read-only area. Fortunately there’s a very simple trick you can do in your script before trying to edit any such files:
cp ${INPUT_TAR_DIR_LOCAL}/file_I_want_to_edit mytmpfile  # do a cp, not mv
rm ${INPUT_TAR_DIR_LOCAL}file_I_want_to_edit # This really just removes the link
mv mytmpfile file_I_want_to_edit # now it's available as an editable regular file.
You certainly don’t want to do this for every file, but for a handful of small text files this is perfectly acceptable and the overall benefits of copying in code via the RCDS far outweigh this small cost. This can get a little complicated when trying to do it for things several directories down, so it’s easiest to have such files in the top level of your tar file.
Video Session Part 2 of 2
Monitor your jobs
For all links below, log in with your FNAL Services credentials (FNAL email, not Kerberos password).
-
What DUNE is doing overall:
https://fifemon.fnal.gov/monitor/d/000000053/experiment-batch-details?orgId=1&var-experiment=dune -
What’s going on with only your jobs:
Remember to change the url with your own username and adjust the time range to cover the region of interest. https://fifemon.fnal.gov/monitor/d/000000116/user-batch-details?orgId=1&var-cluster=fifebatch&var-user=kherner -
Why your jobs are held:
Remember to choose your username in the upper left.
https://fifemon.fnal.gov/monitor/d/000000146/why-are-my-jobs-held?orgId=1
View the stdout/stderr of our jobs
Here’s the link for the history page of the example job: link.
Feel free to sub in the link for your own jobs.
Once there, click “View Sandbox files (job logs)”. In general you want the .out and .err files for stdout and stderr. The .cmd file can sometimes be useful to see exactly what got passed in to your job.
Kibana can also provide a lot of information.
You can also download the job logs from the command line with jobsub_fetchlog:
jobsub_fetchlog --jobid=12345678.0@jobsub0N.fnal.gov --unzipdir=some_appropriately_named_directory
That will download them as a tarball and unzip it into the directory specified by the –unzipdir option. Of course replace 12345678.0@jobsub0N.fnal.gov with your own job ID.
Quiz
Download the log of your last submission via jobsub_fetchlog or look it up on the monitoring pages. Then answer the following questions (all should be available in the .out or .err files):
- On what site did your job run?
- How much memory did it use?
- Did it exit abnormally? If so, what was the exit code?
Brief review of best practices in grid jobs (and a bit on the interactive machines)
- When creating a new workflow or making changes to an existing one, ALWAYS test with a single job first. Then go up to 10, etc. Don’t submit thousands of jobs immediately and expect things to work.
- ALWAYS be sure to prestage your input datasets before launching large sets of jobs.
- Use RCDS; do not copy tarballs from places like scratch dCache. There’s a finite amount of transfer bandwidth available from each dCache pool. If you absolutely cannot use RCDS for a given file, it’s better to put it in resilient (but be sure to remove it when you’re done!). The same goes for copying files from within your own job script: if you have a large number of jobs looking for a same file, get it from resilient. Remove the copy when no longer needed. Files in resilient dCache that go unaccessed for 45 days are automatically removed.
- Be careful about placing your output files. NEVER place more than a few thousand files into any one directory inside dCache. That goes for all type of dCache (scratch, persistent, resilient, etc).
- Avoid commands like
ifdh ls /path/with/wildcards/*/inside grid jobs. That is a VERY expensive operation and can cause a lot of pain for many users. - Use xrootd when opening files interactively; this is much more stable than simply doing
root /pnfs/dune/... - NEVER copy job outputs to a directory in resilient dCache. Remember that they are replicated by a factor of 20! Any such files are subject to deletion without warning.
- NEVER do hadd on files in
/pnfsareas unless you’re usingxrootd. I.e. do NOT do hadd out.root/pnfs/dune/file1 /pnfs/dune/file2 ...This can cause severe performance degradations.
(Time permitting) submit with POMS
POMS is the recommended way of submitting large workflows. It offers several advantages over other systems, such as
- Fully configurable. Any executables can be run, not necessarily only lar or art
- Automatic monitoring and campaign management options
- Multi-stage workflow dependencies, automatic dataset creation between stages
- Automated recovery options
At its core, in POMS one makes a “campaign”, which has one or more “stages”. In our example there is only a single stage.
For analysis use: main POMS page
An example campaign.
Typical POMS use centers around a configuration file (often more like a template which can be reused for many campaigns) and various campaign-specific settings for overriding the defaults in the config file.
An example config file designed to do more or less what we did in the previous submission is here: /dune/app/users/kherner/may2021tutorial/work/pomsdemo.cfg
You can find more about POMS here: POMS User Documentation
Helpful ideas for structuring your config files are here: Fife launch Reference
When you start using POMS you must upload an x509 proxy to the sever before submitting (you can just scp your proxy file from a dunegpvm machine) and it must be named x509up_voms_dune_Analysis_yourusername when you upload it. To upload, look for the User Data item in the left-hand menu on the POMS site, choose Uploaded Files, and follow the instructions.
Finally, here is an example of a campaign that does the same thing as the previous one, using our usual MC reco file from Prod2, but does it via making a SAM dataset using that as the input: POMS campaign stage information. Of course, before running any SAM project, we should prestage our input definition(s):
samweb prestage-dataset kherner-may2021tutorial-mc
replacing the above definition with your own definition as appropriate.
If you are used to using other programs for your work such as project.py, there is a helpful tool called Project-py that you can use to convert existing xml into POMS configs, so you don’t need to start from scratch! Then you can just switch to using POMS from that point forward.
Further Reading
Some more background material on these topics (including some examples of why certain things are bad) are on this PDF:
DUNE Computing Tutorial:Advanced topics and best practices
The Glidein-based Workflow Management System
Key Points
When in doubt, ask! Understand that policies and procedures that seem annoying, overly complicated, or unnecessary (especially when compared to running an interactive test) are there to ensure efficient operation and scalability. They are also often the result of someone breaking something in the past, or of simpler approaches not scaling well.
Send test jobs after creating new workflows or making changes to existing ones. If things don’t work, don’t blindly resubmit and expect things to magically work the next time.
Only copy what you need in input tar files. In particular, avoid copying log files, .git directories, temporary files, etc. from interactive areas.
Take care to follow best practices when setting up input and output file locations.
Always, always, always prestage input datasets. No exceptions.
Coffee Break
Overview
Teaching: 30 min
Exercises: 0 minQuestions
How to take a good break?
Objectives
Relax
Clarify a vague point if it can’t wait until the next session.
Socialize with other participants to add perspective.
Coffee Time
We hope that you will utilize the coffee break time to relax. Of course if you want to wrap on the project at hand, use this extra time. Feel free to ask questions in the live documents.
We want to offer the possibility to exchange with the other participants. To this end, several breakout rooms will be opened during the breaks. Enjoy some social time and meet your new colleagues!
Both the main room and breakout rooms will be available during the coffee breaks.
Key Points
Coffee is good.
Networking with colleagues is essential.
Quiz on Grid Job Submission
Overview
Teaching: 30 min
Exercises: 0 minQuestions
Do you understand grid job submission protocols?
Objectives
Validate your understanding by working through and discussing answers to several questions.
Quiz Time
Arrive on time at 10:30AM CST.
You will be assigned to breakout rooms, in teams of 6. You will have a couple of minutes to introduce yourself.
The questions will be available on Indico at 10:35AM CST. Refresh the timetable and you will see the slideshow.
Discuss solutions to each of the questions. Consider using Software Carpentry’s Etherpad for shared dialog.
You will have 20 minutes.
At the end of the session, a second slide show will be posted with answers.
Enjoy learning!
Video Session
Key Points
Practice makes perfect.
Code-makeover on how to code for better efficiency
Overview
Teaching: 90 min
Exercises: 0 minQuestions
How to write the most efficient code?
Objectives
Learn good tips and tools to improve your code.
DUNE Computing Training May 2021
Session Video
Code Make-over
How to improve your code for better efficiency
DUNE simulation, reconstruction and analysis jobs take a lot of memory and CPU time. This owes to the large size of the Far Detector modules as well as the many channels in the Near Detectors. Reading out a large volume for a long time with high granularity creates a lot of data that needs to be stored and processed.
CPU optimization:
Run with the “prof” build when launching big jobs. While both the “debug” and “prof” builds have debugging and profiling information included in the executables and shared libraries, the “prof” build has a high level of compiler optimization turned on while “debug” has optimizations disabled. Debugging with the “prof” build can be done, but it is more difficult because operations can be reordered and variables put in CPU registers instead of inspectable memory. The “debug” builds are generally much slower, by a factor of four or more. Often this difference is so stark that the time spent repeatedly waiting for a slow program to chug through the first trigger record in an interactive debugging session is more costly than the inconvenience of not being able to see some of the variables in the debugger. If you are not debugging, then there really is (almost) no reason to use the “debug” builds. If your program produces a different result when run with the debug build and the prof build (and it’s not just the random seed), then there is a bug to be investigated.
Compile your interactive ROOT scripts instead of running them in the interpreter At the ROOT prompt, use .L myprogram.C++ (even though its filename is myprogram.C). Also .x myprogram.C++ will compile and then execute it. This will force a compile. .L myprogram.C+ will compile it only if necessary.
Run gprof or other profilers like valgrind’s callgrind: You might be surprised at what is actually taking all the time in your program. There is abundant documentation on the web, and also the valgrind online documentation. There is no reason to profile a “debug” build and there is no need to hand-optimize something the compiler will optimize anyway, and which may even hurt the optimality of the compiler-optimized version.
The Debugger can be used as a simple profiler: If your program is horrendously slow (and/or it used to be fast), pausing it at any time is likely to pause it while it is doing its slow thing. Run your program in the debugger, pause it when you think it is doing its slow thing (i.e. after initialization), and look at the call stack. This technique can be handy because you can then inspect the values of variables that might give a clue if there’s a bug making your program slow. (e.g. looping over 1015 wires in the Far Detector, which would indicate a bug.**.
Don’t perform calculations or do file i/o that will only later be ignored. It’s just a waste of time. If you need to pre-write some code because in future versions of your program the calculation is not ignored, comment it out, or put a test around it so it doesn’t get executed when it is not needed.
Extract constant calculations out of loops.
for (size_t i=0; i<n_channels; ++i)
{
sum += result.at(i)/TMath::Sqrt(2.0);
}
double f = TMath::Sqrt(0.5);
for (size_t i=0; i<n_channels; ++i)
{
sum += result.at(i)*f;
}
The example above also takes advantage of the fact that floating-point multiplies generally have significantly less latency than floating-point divides (still true, even with modern CPU.
Use sqrt(): Don’t use pow() or TMath::Power when a multiplication or sqrt() function can be used.
The reason is that TMath::Power (or the C math library’s pow()) function must take the logarithm of one of its arguments, multiply it by the other argument, and exponentiate the result. Modern CPUs have a built-in SQRT instruction. Modern versions of pow() or Power may check the power argument for 2 and 0.5 and instead perform multiplies and SQRT, but don’t count on it.
If the things you are squaring above are complicated expressions, use TMath::Sq() to eliminate the need for typing them out twice or creating temporary variables. Or worse, evaluating slow functions twice. The optimizer cannot optimize the second call to that function because it may have side effects like printing something out to the screen or updating some internal variable and you may have intended for it to be called twice.
Don’t call sqrt() if you don’t have to.
{
do_something();
}
if (x*x + y*y < rcutsq)
{
do_something();
}
Use binary search features in the STL rather than a step-by-step lookup.
std::vector<int> my_vector;
(fill my_vector with stuff)

size_t indexfound = 0;
bool found = false;
for (size_t i=0; i<my_vector.size(); ++i)
{
  if (my_vector.at(i) == desired_value)
    {
	indexfound = i;
	found = true;
    }
}
If you have to search through a list of items many times, it is best to sort it and use std::lower_bound; see the example here.
std::map is sorted, and std::unordered_map uses a quicker hash table. Generally looking things up in maps is O(log(n)) and in a std::unordered_map is O(1) in CPU time, while searching for it from the beginning is O(n). The bad example above can be sped up by an average factor of 2 by putting a break statement after found=true; if you want to find the first instance of an object. If you want to find the last instance, just count backwards and stop at the first one you find; or use std::upper_bound.
Don’t needlessly mix floats and doubles.
std::vector <double> results;
(fill lots of results)
for (size_t i=0; i<results.size(); ++i)
{
float rsq = results.at(i)*result.at(i);
sum += rsq;
}
std::vector <double> results;
(fill lots of results)
for (size_t i=0; i<results.size(); ++i)
{
sum += TMath::Sq(results.at(i));
}
Check for NaN and Inf. While your program will still function if an intermediate result is NaN or Inf (and it may even produce valid output, especially if the NaN or Inf is irrelevant), processing NaNs and Infs is slower than processing valid numbers. Letting a NaN or an Inf propagate through your calculations is almost never the right thing to do - check functions for domain validity (square roots of negative numbers, logarithms of zero or negative numbers, divide by zero, etc.) when you execute them and decide at that point what to do. If you have a lengthy computation and the end result is NaN, it is often ambiguous at what stage the computation failed.
Minimize cloning TH1’s. It is really slow.
Minimize formatted I/O. Formatting strings for output is CPU-consuming, even if they are never printed to the screen or output to your logfile. MF_LOG_INFO calls for example must prepare the string for printing even if it is configured not to output it.
Use sparse matrix tools where appropriate. This also saves memory.
Minimize database access operations. Bundle the queries together in blocks if possible. Do not pull more information than is needed out of the database. Cache results so you don’t have to repeat the same data retrieval operation.
Use std::vector::reserve() in order to size your vector right if you know in advance how big it will be. std::vector() will, if you push_back() to expand it beyond its current size in memory, allocate twice the memory of the existing vector and copy the contents of the old vector to the new memory. This operation will be repeated each time you start with a zero-size vector and push_back a lot of data.
Factorize your program into parts that do i/o and compute. That way, if you don’t need to do one of them, you can switch it off without having to rewrite everything. Example: Say you read data in from a file and make a histogram that you are sometimes interested in looking at but usually not. The data reader should not always make the histogram by default but it should be put in a separate module which can be steered with fcl so the computations needed to calculate the items to fill the histogram can be saved.
Memory optimization:
Use valgrind. Its default operation checks for memory leaks and invalid accesses. Search the output for the words “invalid” and “lost”. Valgrind is a UPS product you can set up along with everything else.
setup valgrind
valgrind --leak-check=yes myprog arg1 arg2
More information is available here
Use massif. massif is a heap checker, a tool provided with valgrind; see documentation here.
Free up memory after use. Don’t hoard it after your module’s exited.
Don’t constantly re-allocate memory if you know you’re going to use it again right away.
Use STL containers instead of fixed-size arrays, to allow for growth in size. Back in the bad old days (Fortran 77 and earlier), fixed-size arrays had to be declared at compile time that were as big as they possibly could be, both wasting memory on average and creating artificial cutoffs on the sizes of problems that could be handled. This behavior is very easy to replicate in C++. Don’t do it.
Be familiar with the structure and access idioms. These include std::vector, std::map, std::unordered_map, std::set, std::list.
Minimize the use of new and delete to reduce the chances of memory leaks. If your program doesn’t leak memory now, that’s great, but years from now after maintenance has been transferred, someone might introduce a memory leak.
Use move semantics to transfer data ownership without copying it.
Do not store an entire event’s worth of raw digits in memory all at once. Find some way to process the data in pieces.
Consider using more compact representations in memory. A float takes half the space of a double. A size_t is 64 bits long (usually). Often that’s needed, but sometimes it’s overkill.
Optimize the big uses and don’t spend a lot of time on things that don’t matter. If you have one instance of a loop counter that’s a size_t and it loops over a million vector entries, each of which is an int, look at the entries of the vector, not the loop counter (which ought to be on the stack anyway).
Rebin histograms. Some histograms, say binned in channels x ticks or channels x frequency bins for a 2D FFT plot, can get very memory hungry.
Build time optimization:
Minimize the number of #included files. If you don’t need an #include, don’t use it. It takes time to find these files in the search path and include them.
Break up very large source files into pieces. g++’s analysis and optimization steps take an amount of time that grows faster than linearly with the number of source lines.
Workflow optimization:
Pre-stage your datasets It takes a lot of time to wait for a tape (sometimes hours!). CPUs are accounted by wall-clock time, whether you’re using them or not. So if your jobs are waiting for data, they will run slowly even if you optimized the CPU usage. Pre-stage your data!
Run a test job If you have a bug, you will save time by not submitting large numbers of jobs that might not work.
Write out your variables in your own analysis ntuples (TTrees) You will likely have to run over the same MC and data events repeatedly, and the faster this is the better. You will have to adjust your cuts, tune your algorithms, estimate systematic uncertainties, train your deep-learning functions, debug your program, and tweak the appearance of your plots. Ideally, if the data you need to do these operatios is available interctively, you will be able to perform these tasks faster. Choose a minimal set of variables to put in your ntuples to save on storage space.
Write out histograms to ROOTfiles and decorate them in a separate script You may need to experiment many times with borders, spacing, ticks, fonts, colors, line widths, shading, labels, titles, legends, axis ranges, etc. Best not to have to re-compute the contents when you’re doing this, so save the histograms to a file first and read it in to touch it up for presentation.
Key Points
CPU, memory, and build time optimizations are possible when good code practices are followed.
Expert in the Room - LArSoft How to modify a module
Overview
Teaching: 60 min
Exercises: 0 minQuestions
How do I check out, modify, and build DUNE code?
Objectives
How to use mrb.
Set up your environment.
Download source code from DUNE’s git repository.
Build it.
Run an example program.
Modify the job configuration for the program.
Modify the example module to make a custom histogram.
Test the modified module.
Stretch goal – run the debugger.
Video Session
Set up your environment
Note: Pre-recorded microlectures via YouTube links are provided in this lesson, its link preceeding the corresponding text.
YouTube Lecture Part 1: You may need to check your login scripts: .bashrc, .shrc, .profile, .login, etc. for experiment-specific setups for other experiments and even DUNE. This tutorial assumes you have a “clean” login with minimal or no environment set up. You can do simple checks to see if you have any NOvA setups in your environment, try:
env | grep -i nova
Other common conflicting environments come from MINERvA and MicroBooNE, but you could have just about anything. You may have to adjust your login scripts to do experiment-specific setup only when logged in to a particular experiment’s computers. Or you can define aliases that run specific setups when requested, but not automatically on login.
You will need three login sessions. These have different environments set up.
- Session #1 For editing code (and searching for code)
- Session #2 For building (compiling) the software
- Session #3 For running the programs
Start up session #1, editing code, on one of the dunegpvm*.fnal.gov interactive nodes. These scripts have also been tested on the lxplus.cern.ch interactive nodes. Create two scripts in your home directory:
Modification as of September 27, 2021: Due to an incompatible version of mrb that was rolled out on September 21, 2021 and made current, in order to use the older version of dunetpc in this tutorial, we must also use the older version of mrb. Two lines, unsetup mrb and setup mrb -o have been added to the setup scripts. Versions of protoduneana, dunetpc and larsoft v09_31_00 and newer will need the new (current) mrb, and older verisons will use the older version.
newDevMay2021Tutorial.sh should have these contents:
#!/bin/sh

PROTODUNEANA_VERSION=v09_22_02

QUALS=e19:prof
DIRECTORY=may2021tutorial
USERNAME=`whoami`
export WORKDIR=/dune/app/users/${USERNAME}
if [ ! -d "$WORKDIR" ]; then
  export WORKDIR=`echo ~`
fi

source /cvmfs/dune.opensciencegrid.org/products/dune/setup_dune.sh
unsetup mrb
setup mrb -o

cd ${WORKDIR}
touch ${DIRECTORY}
rm -rf ${DIRECTORY}
mkdir ${DIRECTORY}
cd ${DIRECTORY}
mrb newDev -q ${QUALS}
source ${WORKDIR}/${DIRECTORY}/localProducts*/setup
mkdir work
cd srcs
mrb g -t ${PROTODUNEANA_VERSION} protoduneana

cd ${MRB_BUILDDIR}
mrbsetenv
mrb i -j16
and setupMay2021Tutorial.sh should have these contents:
DIRECTORY=may2021tutorial
USERNAME=`whoami`

source /cvmfs/dune.opensciencegrid.org/products/dune/setup_dune.sh
unsetup mrb
setup mrb -o
export WORKDIR=/dune/app/users/${USERNAME}
if [ ! -d "$WORKDIR" ]; then
  export WORKDIR=`echo ~`
fi

cd $WORKDIR/$DIRECTORY
source localProducts*/setup
cd work
mrbslp
Execute this command to make the first script executable.
chmod +x newDevMay2021Tutorial.sh
It is not necessary to chmod the setup script. Problems writing to your home directory? Check to see if your Kerberos ticket has been forwarded.
klist
Start up session #2 by logging in to one of the build nodes,
dunebuild01.fnal.gov or dunebuild02.fnal.gov. They have 16 cores
apiece and the dunegpvm’s have only four, so builds run much faster
on them. If all tutorial users log on to the same one and try
building all at once, the build nodes may become very slow or run
out of memory. The lxplus nodes are generally big enough to build
sufficiently quickly. The Fermilab build nodes should not be used
to run programs (people need them to build code!)
Download source code and build it
On the build node, execute the newDev script:
./newDevMay2021Tutorial.sh
Note that this script will delete the directory planned to store the source code and built code, and make a new directory, in order to start clean. Be careful not to execute this script then if you’ve worked on the code some, as this script will wipe it out and start fresh.
This build script will take a few minutes to check code out and compile it.
The mrb g command does a git clone of the specified repository with an optional tag and destination name. LArSoft repositories (not used in this example but you may want to modify LArSoft code too someday) are hosted these days on GitHub, while DUNE’s repositories, protoduneana, dunetpc, duneutil, and a few others are hosted on Redmine git repositories served by cdcvs.fnal.gov. mrb g is smart enough to be able to clone the repository from the right server. It also tests if you have push permissions and uses the ssh URL if you do, otherwise it falls back to a read-only clone over https. Ask Tom Junk for developer permission for dune code and he can add you to the list. More information is available here.
During testing, I found that my ~/.ssh/known_hosts file had an old entry
for cdcvs.fnal.gov in it, and the mrb g protoduneana command failed because of
it. Solution – edit ~/.ssh/known_hosts and delete the entry for
cdcvs.fnal.gov and try again. You may get a message asking you to add
cdcvs.fnal.gov’s ssh key to your known_hosts file – answer “yes”.
Some comments on the build command
mrb i -j16
The -j16 says how many concurrent processes to run. Set the number to no more than the number of cores on the computer you’re running it on. A dunegpvm machine has four cores, and the two build nodes each have 16. You can find the number of cores a machine has with
cat /proc/cpuinfo
The mrb system builds code in a directory distinct from the source code. Source code is in $MRB_SOURCE and built code is in $MRB_BUILDDIR. If the build succeeds (no error messages, and compiler warnings are treated as errors, and these will stop the build, forcing you to fix the problem), then the built artifacts are put in $MRB_TOP/localProducts*. mrbslp directs ups to search in $MRB_TOP/localProducts* first for software and necessary components like fcl files. It is good to separate the build directory from the install directory as a failed build will not prevent you from running the program from the last successful build. But you have to look at the error messages from the build step before running a program. If you edited source code, made a mistake, built it unsuccessfully, then running the program may run successfully with the last version which compiled. You may be wondering why your code changes are having no effect. You can look in $MRB_TOP/localProducts* to see if new code has been added (look for the “lib” directory under the architecture-specific directory of your product).
Because you ran the newDevMay2021Tutorial.sh script instead of sourcing it, the environment it
set up within it is not retained in the login session you ran it from. You will need to set up your environment again.
You will need to do this when you log in anyway, so it is good to have
that setup script. In session #2, type this:
  source setupMay2021Tutorial.sh
  cd $MRB_BUILDDIR
  mrbsetenv
The shell command “source” instructs the command interpreter (bash) to read commands from the file setupMay2021Tutorial.sh as if they were typed at the terminal. This way, environment variables set up by the script stay set up.
Do the following in session #1, the source editing session:
source setupMay2021Tutorial.sh
  cd $MRB_SOURCE
  mrbslp
Run your program
YouTube Lecture Part 2: Start up the session for running programs – log in to a dunegpvm interactive
computer for session #3
  source setupMay2021Tutorial.sh
  mrbslp
  setup_fnal_security
We need to locate an input file. Here are some tips for finding input data:
https://wiki.dunescience.org/wiki/Look_at_ProtoDUNE_SP_data
Data and MC files are typically on tape, but can be cached on disk so you don’t have to wait possibly a long time for the file to be staged in. Check to see if a sample file is in dCache or only on tape:
cache_state.py PDSPProd4_protoDUNE_sp_reco_stage1_p1GeV_35ms_sce_datadriven_41094796_0_20210121T214555Z.root
Get the xrootd URL:
samweb get-file-access-url --schema=root PDSPProd4_protoDUNE_sp_reco_stage1_p1GeV_35ms_sce_datadriven_41094796_0_20210121T214555Z.root
which should print the following URL:
root://fndca1.fnal.gov:1094/pnfs/fnal.gov/usr/dune/tape_backed/dunepro/protodune-sp/full-reconstructed/2021/mc/out1/PDSPProd4/40/57/23/91/PDSPProd4_protoDUNE_sp_reco_stage1_p1GeV_35ms_sce_datadriven_41094796_0_20210121T214555Z.root
Now run the program with the input file accessed by that URL:
lar -c analyzer_job.fcl root://fndca1.fnal.gov:1094/pnfs/fnal.gov/usr/dune/tape_backed/dunepro/protodune-sp/full-reconstructed/2021/mc/out1/PDSPProd4/40/57/23/91/PDSPProd4_protoDUNE_sp_reco_stage1_p1GeV_35ms_sce_datadriven_41094796_0_20210121T214555Z.root
CERN Users without access to Fermilab’s dCache: – example input files for this tutorial have been copied to /afs/cern.ch/work/t/tjunk/public/may2021tutorialfiles/.
After running the program, you should have an output file tutorial_hist.root. Note – please do not
store large rootfiles in /dune/app! The disk is rather small, and we’d like to
save it for applications, not data. But this file ought to be quite small.
Open it in root
root tutorial_hist.root
and look at the histograms and trees with a TBrowser. It is empty!
Adjust the program’s job configuration
In Session #1, the code editing session,
cd ${MRB_SOURCE}/protoduneana/protoduneana/TutorialExamples/
See that analyzer_job.fcl includes clustercounter.fcl. The module_type
line in that fcl file defines the name of the module to run, and
ClusterCounter_module.cc just prints out a message in its analyze() method
just prints out a line to stdout for each event, without making any
histograms or trees.
Aside on module labels and types: A module label is used to identify
which modules to run in which order in a trigger path in an art job, and also
to label the output data products. The module type is the name of the source
file: <moduletype>_module.cc is the filename of the source code for a module
with class name moduletype. The build system preserves this and makes a shared object (.so)
library that art loads when it sees a particular module_type in the configuration document.
The reason there are two names here is so you
can run a module multiple times in a job, usually with different inputs. Underscores
are not allowed in module types or module labels because they are used in
contexts that separate fields with underscores.
Let’s do something more interesting than ClusterCounter_module’s print statement.
Let’s first experiment with the configuration to see if we can get some output. In Session #3 (the running session),
fhicl-dump analyzer_job.fcl > tmp.txt
and open tmp.txt in a text editor. You will see what blocks in there
contain the fcl parameters you need to adjust.
Make a new fcl file in the work directory
called myana.fcl with these contents:
#include "analyzer_job.fcl"

physics.analyzers.clusterana.module_type: "ClusterCounter3"
Try running it:
lar -c myana.fcl root://fndca1.fnal.gov:1094/pnfs/fnal.gov/usr/dune/tape_backed/dunepro/protodune-sp/full-reconstructed/2021/mc/out1/PDSPProd4/40/57/23/91/PDSPProd4_protoDUNE_sp_reco_stage1_p1GeV_35ms_sce_datadriven_41094796_0_20210121T214555Z.root
but you will get error messages about “product not found”.
Inspection of ClusterCounter3_module.cc in Session #1 shows that it is
looking for input clusters. Let’s see if we have any in the input file,
but with a different module label for the input data.
Look at the contents of the input file:
product_sizes_dumper root://fndca1.fnal.gov:1094/pnfs/fnal.gov/usr/dune/tape_backed/dunepro/protodune-sp/full-reconstructed/2021/mc/out1/PDSPProd4/40/57/23/91/PDSPProd4_protoDUNE_sp_reco_stage1_p1GeV_35ms_sce_datadriven_41094796_0_20210121T214555Z.root | grep -i cluster
There are clusters with module label “pandora” but not
lineclusterdc which you can find in the tmp.txt file above. Now edit myana.fcl to say
#include "analyzer_job.fcl"

physics.analyzers.clusterana.module_type: "ClusterCounter3"
physics.analyzers.clusterana.ClusterModuleLabel: "pandora"
and run it again:
lar -c myana.fcl root://fndca1.fnal.gov:1094/pnfs/fnal.gov/usr/dune/tape_backed/dunepro/protodune-sp/full-reconstructed/2021/mc/out1/PDSPProd4/40/57/23/91/PDSPProd4_protoDUNE_sp_reco_stage1_p1GeV_35ms_sce_datadriven_41094796_0_20210121T214555Z.root
Lots of information on job configuration via FHiCL is available at this link
Editing the example module and building it
YouTube Lecture Part 3: Now in session #1, edit ${MRB_SOURCE}/protoduneana/protoduneana/TutorialExamples/ClusterCounter3_module.cc
Add
#include "TH1F.h"
to the section with includes.
Add a private data member
TH1F *fTutorialHisto;
to the class. Create the histogram in the beginJob() method:
fTutorialHisto = tfs->make<TH1F>("TutorialHisto","NClus",100,0,500);
Fill the histo in the analyze() method, after the loop over clusters:
fTutorialHisto->Fill(fNClusters);
Go to session #2 and build it. The current working directory should be the build directory:
make install -j16
Note – this is the quicker way to re-build a product. The -j16 says to use 16 parallel processes,
which matches the number of cores on a build node. The command
mrb i -j16
first does a cmake step – it looks through all the CMakeLists.txt files and processes them,
making makefiles. If you didn’t edit a CMakeLists.txt file or add new modules or fcl files
or other code, a simple make can save you some time in running the single-threaded cmake step.
Rerun your program in session #3 (the run session)
lar -c myana.fcl root://fndca1.fnal.gov:1094/pnfs/fnal.gov/usr/dune/tape_backed/dunepro/protodune-sp/full-reconstructed/2021/mc/out1/PDSPProd4/40/57/23/91/PDSPProd4_protoDUNE_sp_reco_stage1_p1GeV_35ms_sce_datadriven_41094796_0_20210121T214555Z.root
Open the output file in a TBrowser:
root tutorial_hist.root
and browse it to see your new histogram. You can also run on some data.
lar -c myana.fcl -T dataoutputfile.root root://fndca1.fnal.gov:1094/pnfs/fnal.gov/usr/dune/tape_backed/dunepro/protodune-sp/full-reconstructed/2020/detector/physics/PDSPProd4/00/00/53/87/np04_raw_run005387_0041_dl7_reco1_13832298_0_20201109T215042Z.root
The -T dataoutputfile.root changes the output filename for the TTrees and
histograms to dataoutputfile.root so it doesn’t clobber the one you made
for the MC output.
This iteration of course is rather slow – rebuilding and running on files in dCache. Far better,
if you are just changing histogram binning, for example, is to use the output TTree.
TTree::MakeClass is a very useful way to make a script that reads in the TBranches of a TTree on
a file. The workflow in this tutorial is also useful in case you decide to add more content
to the example TTree.
Run your program in the debugger
YouTube Lecture Part 4: In session #3 (the running session)
  setup forge_tools

  ddt `which lar` -c myana.fcl root://fndca1.fnal.gov:1094/pnfs/fnal.gov/usr/dune/tape_backed/dunepro/protodune-sp/full-reconstructed/2021/mc/out1/PDSPProd4/40/57/23/91/PDSPProd4_protoDUNE_sp_reco_stage1_p1GeV_35ms_sce_datadriven_41094796_0_20210121T214555Z.root
Click the “Run” button in the window that pops up. The which lar is needed because ddt cannot find
executables in your path – you have to specify their locations explicitly.
In session #1, look at ClusterCounter3_module.cc in a text editor that lets you know what the line numbers are.
Find the line number that fills your new histogram. In the debugger window, select the “Breakpoints”
tab in the bottom window, and usethe right-mouse button (sorry mac users – you may need to get an external
mouse if you are using VNC. XQuartz emulates a three-button mouse I believe). Make sure the “line”
radio button is selected, and type ClusterCounter3_module.cc for the filename. Set the breakpoint
line at the line you want, for the histogram filling or some other place you find interesting. Click
Okay, and “Yes” to the dialog box that says ddt doesn’t know about the source code yet but will try to
find it when it is loaded.
Click the right green arrow to start the program. Watch the program in the Input/Output section. When the breakpoint is hit, you can browse the stack, inspect values (sometimes – it is better when compiled with debug), set more breakpoints, etc.
You will need Session #1 to search for code that ddt cannot find. Shared object libraries contain information about the location of the source code when it was compiled. So debugging something you just compiled usually results in a shared object that knows the location of the source, but installed code in CVMFS points to locations on the Jenkins build nodes.
Looking for source code:
Your environment has lots of variables pointing at installed code. Look for variables like
DUNETPC_DIR
which points to a directory in CVMFS.
  ls $DUNETPC_DIR/source

or $LARDATAOBJ_DIR/include
are good examples of places to look for code, for example.
Checking out and committing code to the git repository
For protoduneana and dunetpc, this wiki page is quite good. LArSoft uses GitHub with a pull-request model. See
https://cdcvs.fnal.gov/redmine/projects/larsoft/wiki/Developing_With_LArSoft
https://cdcvs.fnal.gov/redmine/projects/larsoft/wiki/Working_with_GitHub
Common errors and recovery
Version mismatch between source code and installed products
When you perform an mrbsetenv or a mrbslp, sometimes you get a version mismatch. The most common reason for this is that you have set up an older version of the dependent products (protoduneana depends on dunetpc, which depends on larsoft, which depends on art, ROOT, GEANT4, and many other products). If the source code is newer than the installed products, the versions may mismatch. You can check out an older version of the source code (see the example above) with
mrb g -t <tag> repository
Alternatively, if you have already checked out some code, you can switch to a different tag using your local clone of the git repository.
  cd $MRB_SOURCE/<product>
  git checkout <tag>
Try mrbsetenv again after checking out a consistent version.
Telling what version is the right one
The versions of dependent products for a product you’re building from source are listed in the file $MRB_SOURCE/<product>/ups/product_deps`.
Sometimes you may want to know what the version number is of a product way down on the dependency tree so you can check out its source and edit it. Set up the product in a separate login session:
  source /cvmfs/dune.opensciencegrid.org/products/dune/setup_dune.sh
  setup <product> -q <quals>
  ups active
It usually is a good idea to pipe the output through grep to find a particular product version. You can get dependency information with
ups depend <product> -q <quals>
Note: not all dependencies of dependent products are listed by this command. If a product is already listed, it sometimes is not listed a second time, even if two products in the tree depend on it. Some products are listed multiple times.
There is a script in duneutil called dependency_tree.sh which makes graphical displays of dependency trees.
Inconsistent build directory
The directory $MRB_BUILD contains copies of built code before it gets installed to localProducts. If you change versions of the source or delete things, sometimes the build directory will have clutter in it that has to be removed.
mrb z
will delete the contents of $MRB_BUILDDIR and you will have to type mrbsetenv again.
mrb zd
will also delete the contents of localProducts. This can be useful if you are removing code and want to make sure the installed version also has it gone.
Inconsistent environment
When you use UPS’s setup command, a lot of variables get defined. For each product, a variable called <product>_DIR is defined, which points to the location of the version and flavor of the product. UPS has a command “unsetup” which often succeeds in undoing what setup does, but it is not perfect. It is possible to get a polluted environment in which inconsistent versions of packages are set up and it is too hard to repair it one product at a time. Logging out and logging back in again, and setting up the session is often the best way to start fresh.
The setup command is the wrong one
If you have not sourced the DUNE software setup script
source /cvmfs/dune.opensciencegrid.org/products/dune/setup_dune.sh
you will find that the setup command that is used instead is one provided by the operating system and it requires root privilege to execute and setup will ask you for the root password. Rather than typing that if you get in this situation, ctrl-c, source the setup_dune.sh script and try again.
Compiler and linker warnings and errors
Common messages from the g++ compiler are undeclared variables, uninitialized variables, mismatched parentheses or brackets, missing semicolons, checking unsigned variables to see if they are positive (yes, that’s a warning!) and other things. mrb is set up to tell g++ and clang to treat warnings as errors, so they will stop the build and you will have to fix them. Often undeclared variables or methods that aren’t members of a class messages result from having forgotten to include the appropriate include file.
The linker has fewer ways to fail than the compiler. Usually the error message is “Undefined symbol”. The compiler does not emit this message, so you always know this is in the link step. If you have an undefined symbol, one of three things may have gone wrong. 1) You may have mistyped it (usually this gets caught by the compiler because names are defined in header files). More likely, 2) You introduced a new dependency without updating the CMakeLists.txt file. Look in the CMakeLists.txt file that steers the building of the source code that has the problem. Look at other CMakeLists.txt files in other directories for examples of how to refer to libraries. ` MODULE_LIBRARIES are linked with modules in the ART_MAKE blocks, and LIB_LIBRARIES` are linked when building non-module libraries (free-floating source code, for algorithms). 3) You are writing new code and just haven’t gotten around to finishing writing something you called.
Out of disk quota
Do not store data files on the app disk! Sometimes the app disk fills up nonetheless, and there is a quota of 100 GB per user on it. If you need more than that for several builds, you have some options. 1) Use /dune/data/users/<username> (make the directory if it does not yet exist). Also /dune/data2/users/<username> is available. You have a 200 GB quota on each of these volumes. They are slower than the app disk and can get even slower if many users are accessing them simultaneously or transferring large amounts of data to or ofrm them. 3) Clean up some space on app. You may want to tar up an old release and store the tarball on the data volume or in dCache for later use.
Runtime errors
Segmentation faults: These do not throw errors that art can catch – they terminate the program immediately. Use the debugger to find out where they happened and why.
Exceptions that are caught. The ddt debugger has in its menu a set of standard breakpoints. You can instruct the debugger to stop any time an exception is thrown. A common exception is a vector accessed past its size using at(), but often these are hard to track down because they could be anywhere. Start your program with the debugger, but it is often a good idea to turn off the break-on-exception feature until after the geometry has been read in. Some of the XML parsing code throws a lot of exceptions that are later caught as part of its normal mode of operation, and if you hit a breakpoint on each of these and push the “go” button with your mouse each time, you could be there all day. Wait until the initialization is over, press “pause” and then turn on the breakpoints by exception.
If you miss, start the debugging session over again. Starting the session over is also a useful technique when you want to know what happened before a known error condition occurs. You may find yourself asking “how did it get in that condition? Set a breakpoint that’s earlier in the execution and restart the session. Keep backing up – it’s kind of like running the program in reverse, but it’s very slow. Sometimes it’s the only way.
Print statements are also quite useful for rare error conditions. If a piece of code fails infrequently, based on the input data, sometimes a breakpoint is not very useful because most of the time it’s fine and you need to catch the program in the act of misbehaving. Putting in a low-tech print statement, sometimes with a uniquely-identifying string so you can grep the output, can let you put some logic in there to print only when things have gone bad, or even if you print on each iteration, you can just look at the last bit of printout before a crash.
No authentication/permission
You will almost always need to have a valid Kerberos ticket in your session. Accessing your home directory on the Fermilab machines requires it. Find your tickets with the command
klist
By default, they last for 25 hours or so (a bit more than a day). You can refresh them for another 25 hours (up to one week’s worth of refreshes are allowed) with
kinit -R
If you have a valid ticket on one machine and want to refresh tickets on another, you can
k5push <nodename>
The safest way to get a new ticket to a machine is to kinit on your local computer (like your laptop) and log in again,
making sure to forward all tickets. In a pinch, you can run kinit on a dunegpvm and enter your Kerberos password, but this is discouraged as bad actors can (and have!) installed keyloggers on shared systems, and have stolen passwords. DO NOT KEEP PRIVATE, PERSONAL INFORMATION ON FERMILAB COMPUTERS! Things like bank account numbers, passwords, and social security numbers are definitely not to be stored on public, shared computers. Running kinit -R on a shared machine is fine.
You will need a grid proxy to submit jobs and access data in dCache via xrootd or ifdh.
setup_fnal_security
will use your valid Kerberos ticket to generate the necessary certificates and proxies.
Link to art/LArSoft tutorial May 2021
https://wiki.dunescience.org/wiki/Presentation_of_LArSoft_May_2021
Key Points
DUNE’s software stack is built out of a tree of UPS products.
You don’t have to build all of the software to make modifications – you can check out and build one or more products to achieve your goals.
You can set up pre-built CVMFS versions of products you aren’t developing, and UPS will check version consistency, though it is up to you to request the right versions.
mrb is the tool DUNE uses to check out software from multiple repositories and build it in a single test release.
mrb uses git and cmake, though aspects of both are exposed to the user.
Code-makeover - Submit with POMS
Overview
Teaching: 60 min
Exercises: 0 minQuestions
How to submit grid jobs with POMS?
Objectives
Demonstrate use of POMS for job submission.
Video Session
Submit with POMS
This lesson extends from earlier work: Grid Job Submission and Common Errors
POMS is the recommended way of submitting large workflows. It offers several advantages over other systems, such as
- Fully configurable. Any executables can be run, not necessarily only lar or art
- Automatic monitoring and campaign management options
- Multi-stage workflow dependencies, automatic dataset creation between stages
- Automated recovery options
At its core, in POMS one makes a “campaign”, which has one or more “stages”. In our example there is only a single stage.
For analysis use: main POMS page
An example campaign.
Typical POMS use centers around a configuration file (often more like a template which can be reused for many campaigns) and various campaign-specific settings for overriding the defaults in the config file.
An example config file designed to do more or less what we did in the previous submission is here: /dune/app/users/kherner/may2021tutorial/work/pomsdemo.cfg
You can find more about POMS here: POMS User Documentation
Helpful ideas for structuring your config files are here: Fife launch Reference
When you start using POMS you must upload an x509 proxy to the sever before submitting (you can just scp your proxy file from a dunegpvm machine) and it must be named x509up_voms_dune_Analysis_yourusername when you upload it. To upload, look for the User Data item in the left-hand menu on the POMS site, choose Uploaded Files, and follow the instructions.
Finally, here is an example of a campaign that does the same thing as the previous one, using our usual MC reco file from Prod2, but does it via making a SAM dataset using that as the input: POMS campaign stage information. Of course, before running any SAM project, we should prestage our input definition(s):
samweb prestage-dataset kherner-may2021tutorial-mc
replacing the above definition with your own definition as appropriate.
If you are used to using other programs for your work such as project.py, there is a helpful tool called Project-py that you can use to convert existing xml into POMS configs, so you don’t need to start from scratch! Then you can just switch to using POMS from that point forward.
Key Points
Always, always, always prestage input datasets. No exceptions.
Coffee Break
Overview
Teaching: 30 min
Exercises: 0 minQuestions
How to take a good break?
Objectives
Relax
Clarify a vague point if it can’t wait until the next session.
Socialize with other participants to add perspective.
Coffee Time
We hope that you will utilize the coffee break time to relax. Of course if you want to wrap on the project at hand, use this extra time. Feel free to ask questions in the live documents.
We want to offer the possibility to exchange with the other participants. To this end, several breakout rooms will be opened during the breaks. Enjoy some social time and meet your new colleagues!
Both the main room and breakout rooms will be available during the coffee breaks.
Key Points
Coffee is good.
Networking with colleagues is essential.
Quiz on Best Programming Practices
Overview
Teaching: 30 min
Exercises: 0 minQuestions
Is programming your forte?
Objectives
Validate your understanding by working through some examples.
Quiz Time
Arrive on time at 10:30AM CST.
You will be assigned to breakout rooms, in teams of 6. You will have a couple of minutes to introduce yourself.
The questions will be available on Indico at 10:35AM CST. Refresh the timetable and you will see the slideshow.
Discuss solutions to each of the questions. Consider using Software Carpentry’s Etherpad for shared dialog.
You will have 20 minutes.
At the end of the session, a second slide show will be posted with answers.
Enjoy learning!
Key Points
Practice makes perfect.
Expert in the Room Grid and Batch System
Overview
Teaching: 75 min
Exercises: 0 minQuestions
How to become a grid and batch yoda master?
Objectives
Learn common job failures and how to avoid them in the future
Get tips and tricks to debug on your own
Video Session
Debug Session
This session of Expert in the Room is a Q&A. You bring content!
Write on the live doc your current error(s) and experts will provide guidance to participants in a live debug session.
On top of learning why a job failed, we hope it will give you the tools to solve future issues by yourself.
Debugging is an art.
Confusion is the sweat of learning.
Key Points
Debugging requires a methodical and inquisitive mindset, gained through experience and good bookkeeping (write down how to you solved past issues!)
Closing Remarks
Overview
Teaching: 15 min
Exercises: 0 minQuestions
Are you fortified with enough information to start your event analysis?
Objectives
Reflect on the days of learning.
Closing Remarks
Video Session
Three Days of Training
The instruction in this three day workshop is provided by several experienced physicists and is based on years of collaborative experience.
The secure access to Fermilab computing systems and a familiarity with data storage are key components.
Data management and event processing tools were described and modeled.
LArSoft was introduced, with an example of workflow so analyzers can know how to make their own module.
Protocols for efficient job submission and monitoring has been demonstrated.
We are thankful for the instructor’s hard work, and for the numerous participants who joined.
Survey time!
Please give us feedback on this training by filling out this
It is anonymous. Send us your impressions, praise, critiques and suggestions! Thank you very much.
Next Steps
Video recordings of the sessions have been posted within each lesson.
We invite you to bookmark this training site and to revisit the content regularly.
Point a colleague to the material.
Long Term Support
You made some excellent connections with computing experts and invite your continued dialog.
A DUNE Slack channel will remain available and we encourage your activity in the dialog.
Key Points
The DUNE Computing Consortium has presented this workshop so as to broaden the use of software tools used for analysis.